Understanding V5 Data Studio Reports
10 minute read
Beginner
Prerequisites
Video Tutorial
Why should you connect to the V5 Template Dashboard?
Deploying your chatbot program can generate tremendous value at scale for your users, the template dashboard enables the crucial other half of your chatbot program.
- It enables your organisation to monitor and evaluate the health of your chatbot program, so that you may iterate and improve the experience for your users.
- The dashboard also serves as a repository of user information that your field/remote operations teams can easily download to engage more deeply with your stakeholders.
The template dashboard aims to make as much common chatbot program information accessible to your organisation as possible. You may use what is relevant to your program. Beyond this, you might want to tweak this dashboard to further suit your needs, refer to google support to learn how to do this.
Understanding the pages in the Dashboard
1. Overview
This page has been created to give your organisation a sense of the overall health of your chatbot progream. It is divided into 3 broad sections, described below. The page has one date range filter at the top left which is set to the last 30 days by default.
Stakeholder Engagement Overview
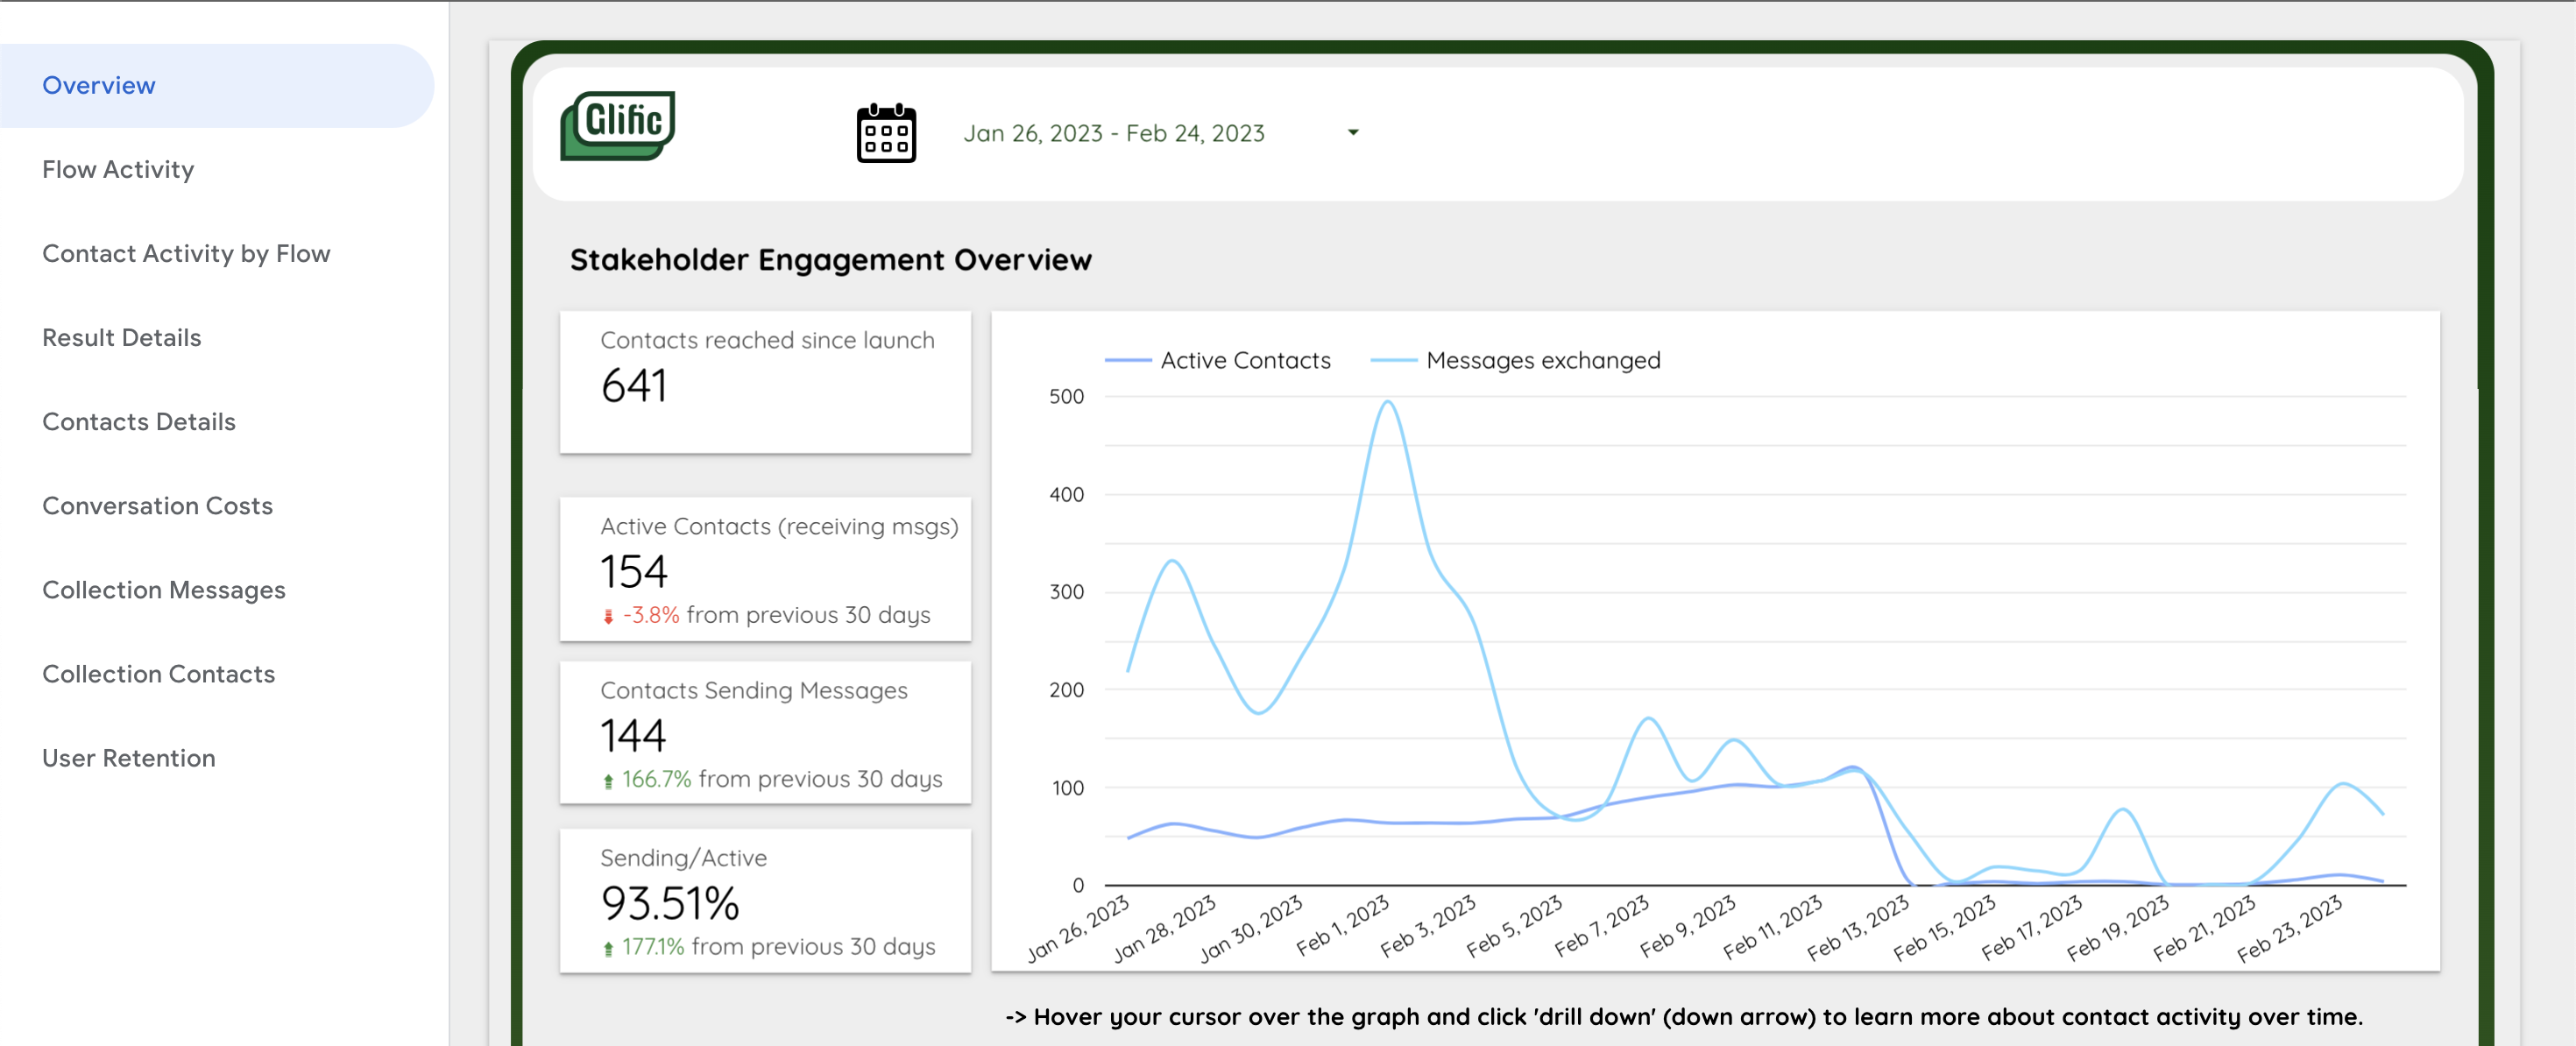
This section of the overview page tells you about the number of people/phone numbers that have engaged (sent or recieved messages) with your chatbot.
Contacts reached since launch: The total number of phone numbers that have ever engaged with your chatbot till today. This number will not change when you alter the date range filter.
Active Contacts (recieving messages): The total number of phone numbers that have recieved a message in the selected time period. It is important to note that all contacts who have recieved a message might not have sent a message back to you, but all those who have sent a message to your bot would definitely have recieved a message back.
Contacts sending messages: The total number of phone numbers that have sent a message to your chatbot in the selected time period. This is a subset of your Active Contacts value.
Sending/Active: The percentage of phone numbers who are sending messaged to your chatbot as compared to the total number of phone numbers that have received messages. Based on the nature of your program you could decide what percentage indicates good engagement.
Active contacts and messages exchanged graph: This is a very useful graph that helps you analyse the trends of contacts engaged and messages sent over time.
Note: If you hover your cursor over the top right corner of this graph and click on the down arrow, you can learn about engagement trends over months, days of the week and hours of the day. Give it a try!
Messages and Conversations Overview
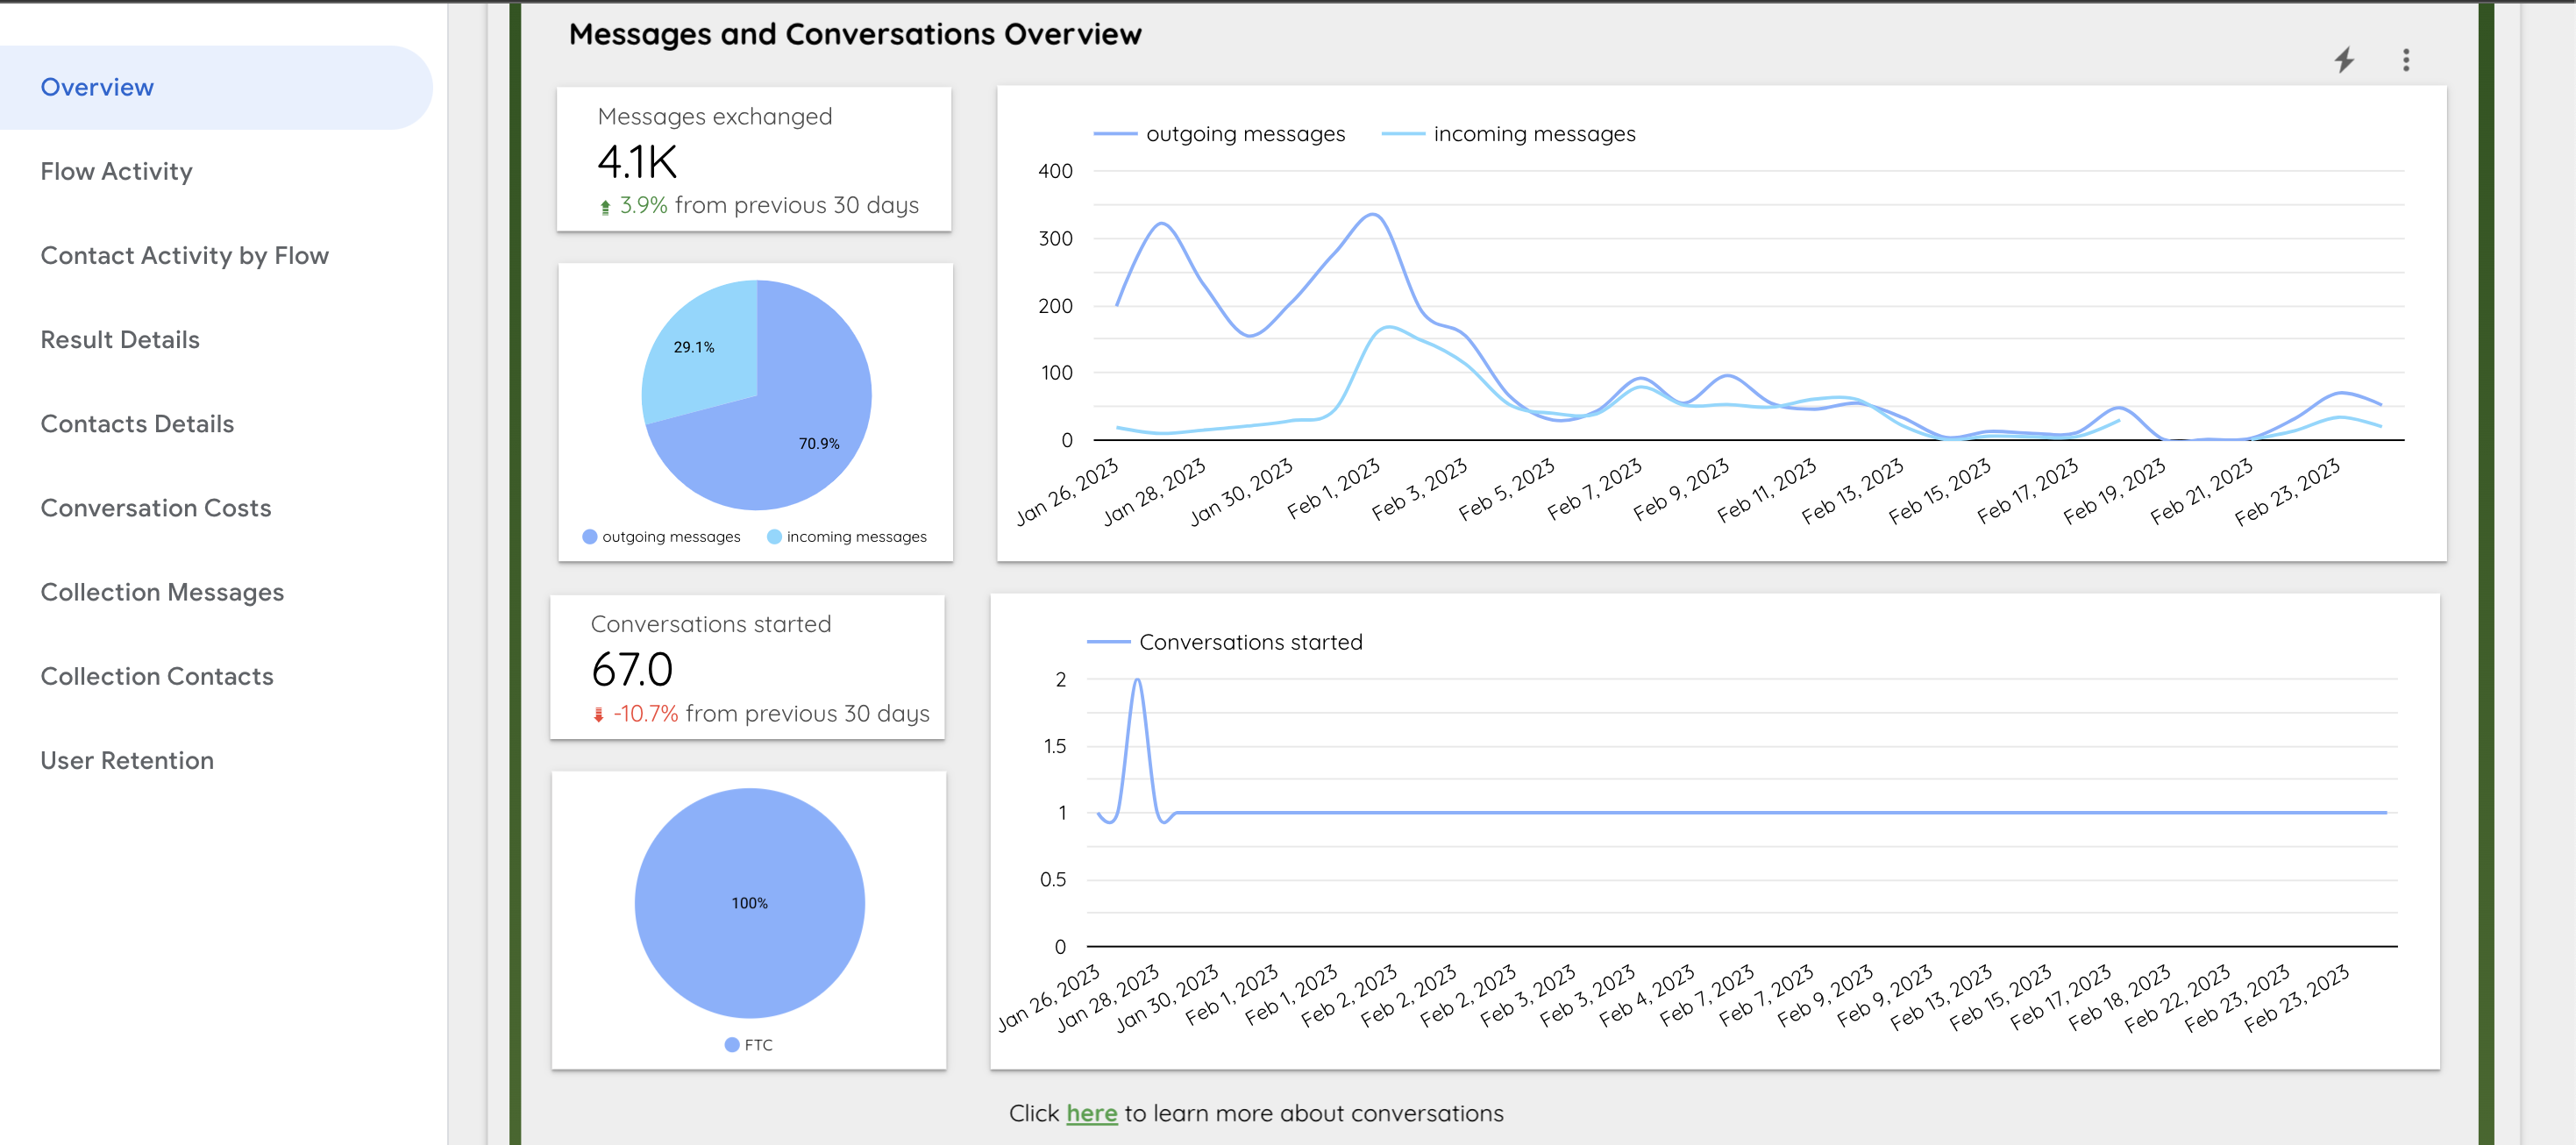
This section of the overview page tells you about the number and types of messages and conversations you have exchanged. Messages and conversations impact costs and can be seen in further detail the conversation costs page of your report.
- Messages exchanged: The total number of messages that have been sent by the bot (outgoing) or recieved by the bot (incoming) in the selected time period.
- Outgoing and Incoming messages pie chart: The distribution of total messages exchanged.
- Outgoing and Incoming messages graph: The daywise trend of messages exchanged over time.
- Conversations started: The total number of unique conversations started during the selected time period. A single conversation is defined a 24 hour window from the first message sent by your bot.
- Conversation type pie chart: The distribution of conversation types. Different conversation types are charged differently. Refer here.
- Conversations Graph: The daywise trend of total number of conversations over time for the selected time period.
Contact Opt in/Opt out Overview
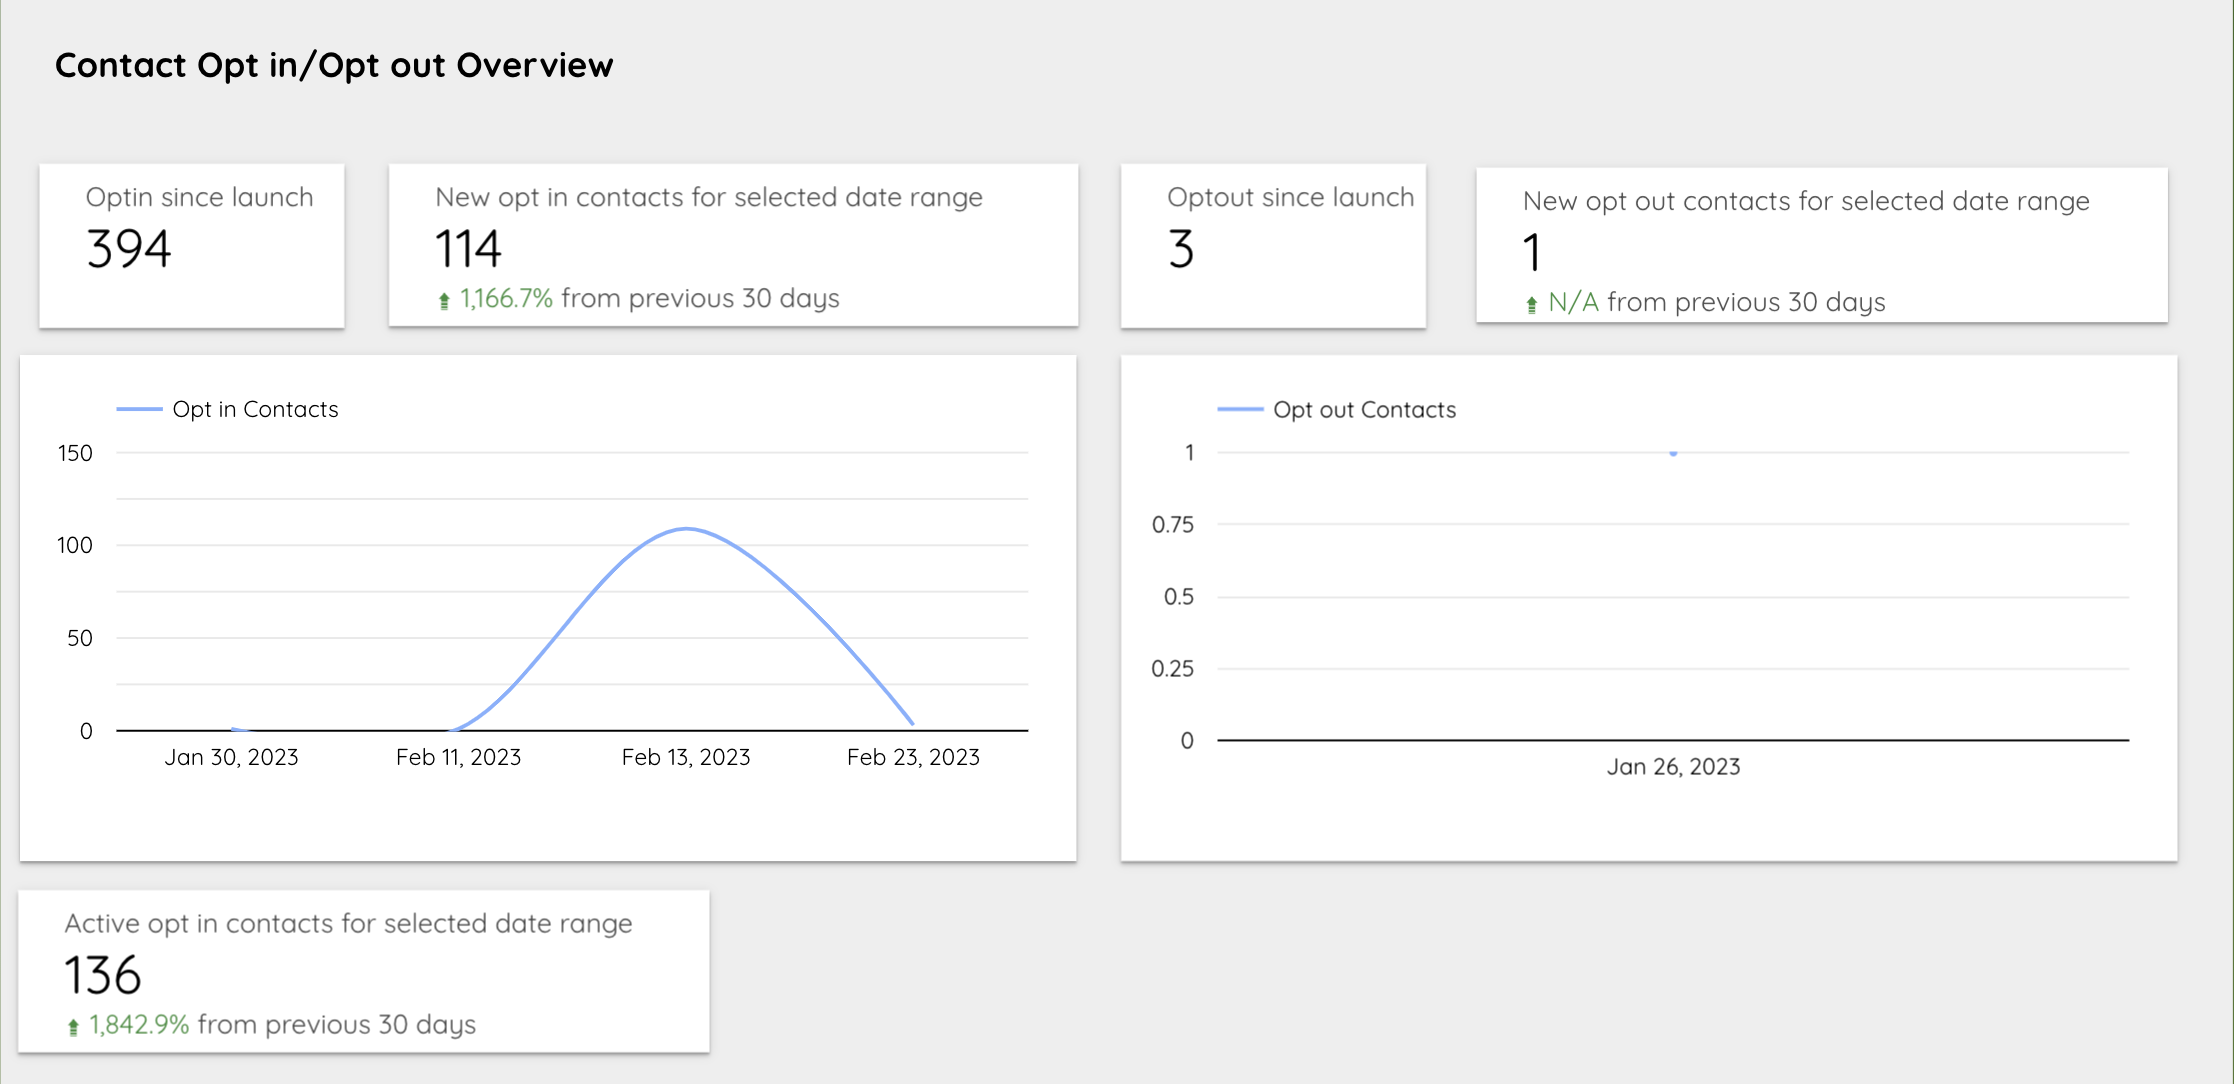
This section is especially useful during the onboarding phase/s of your program. An important first step in using the chatbot is getting your users consent or to 'opt in' to receive messages from you. This is required by WA/Facebook to ensure that people do not recieve spam messages.
- Opt in since launch: The total contacts who have opted in since your chatbot started
- New optins: The users who have opted in during the selected time period.
- Optin Graph: The day wise trend of optins for the selected time period.
- Active opt in contacts: The total optin contacts recieveing or sending messages in the selected time period.
Similarly for the the 3 corresponding opt out visuals.
2. Flow Activity
This page has been created to help you monitor your flows. It is divided into 4 broad sections, described below. This page has a date range filter and a flow name filter which allows you to see data for a specific flow during a specific time period.
Flow Activity Overview
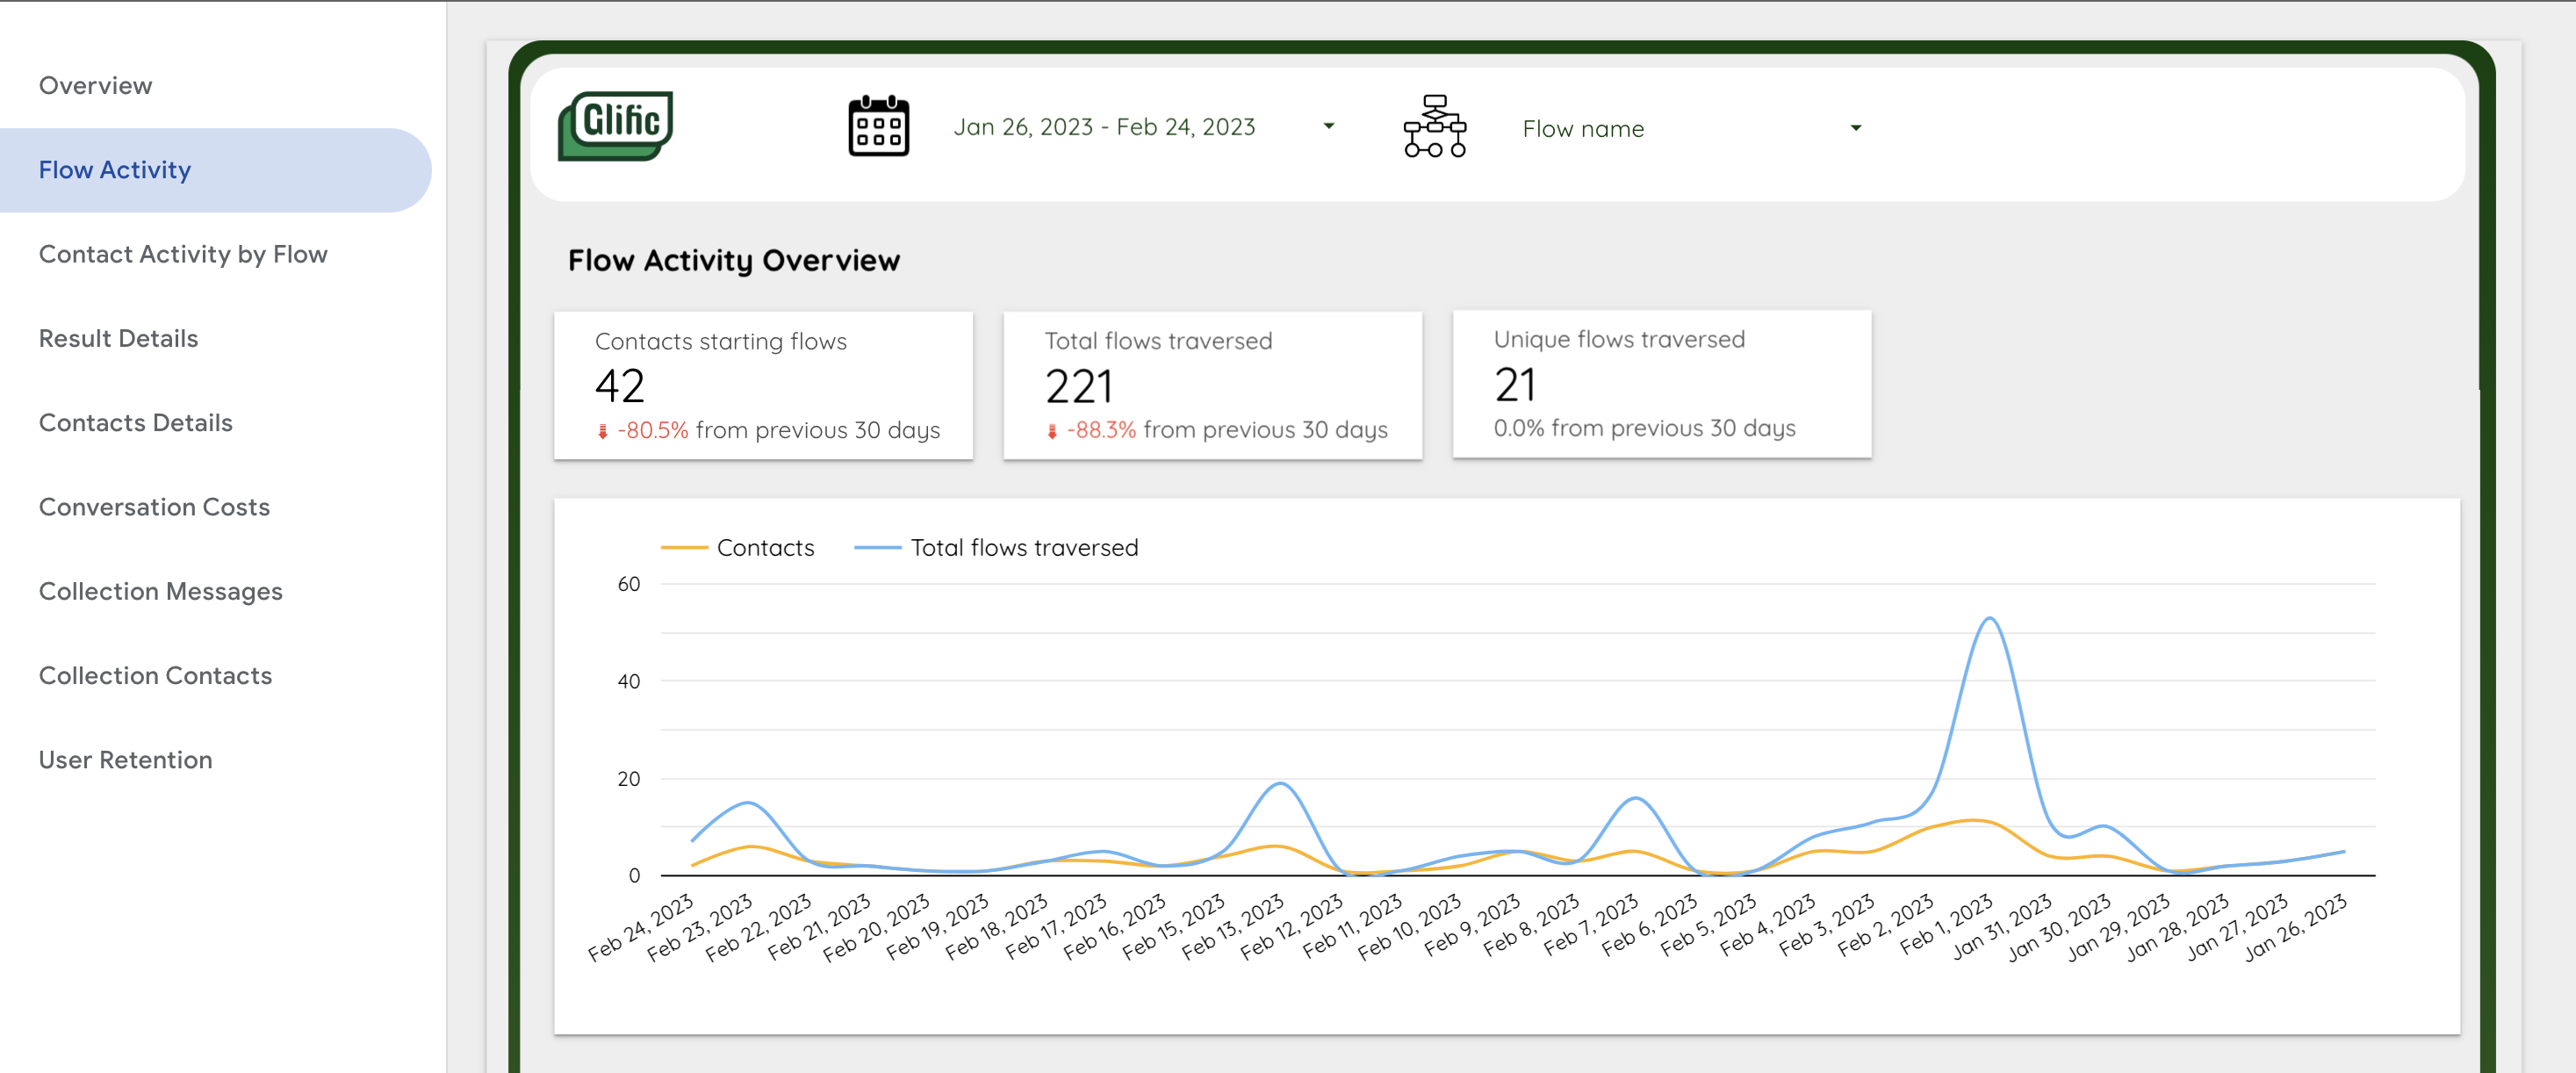
This section tells you how many people are going through the flows and how often.
- Contacts starting flows: The number of contacts starting selected flows in the selected time period.
- Total flows traversed: The total number of times the selected flows have been entered in the selected time period.
- Unique flows traversed: A count of the unique flows entered in the selected time period.
- Contacts and total flows traversed graph: The Daywise trend of contact and flow activity over time.
Flows Completed
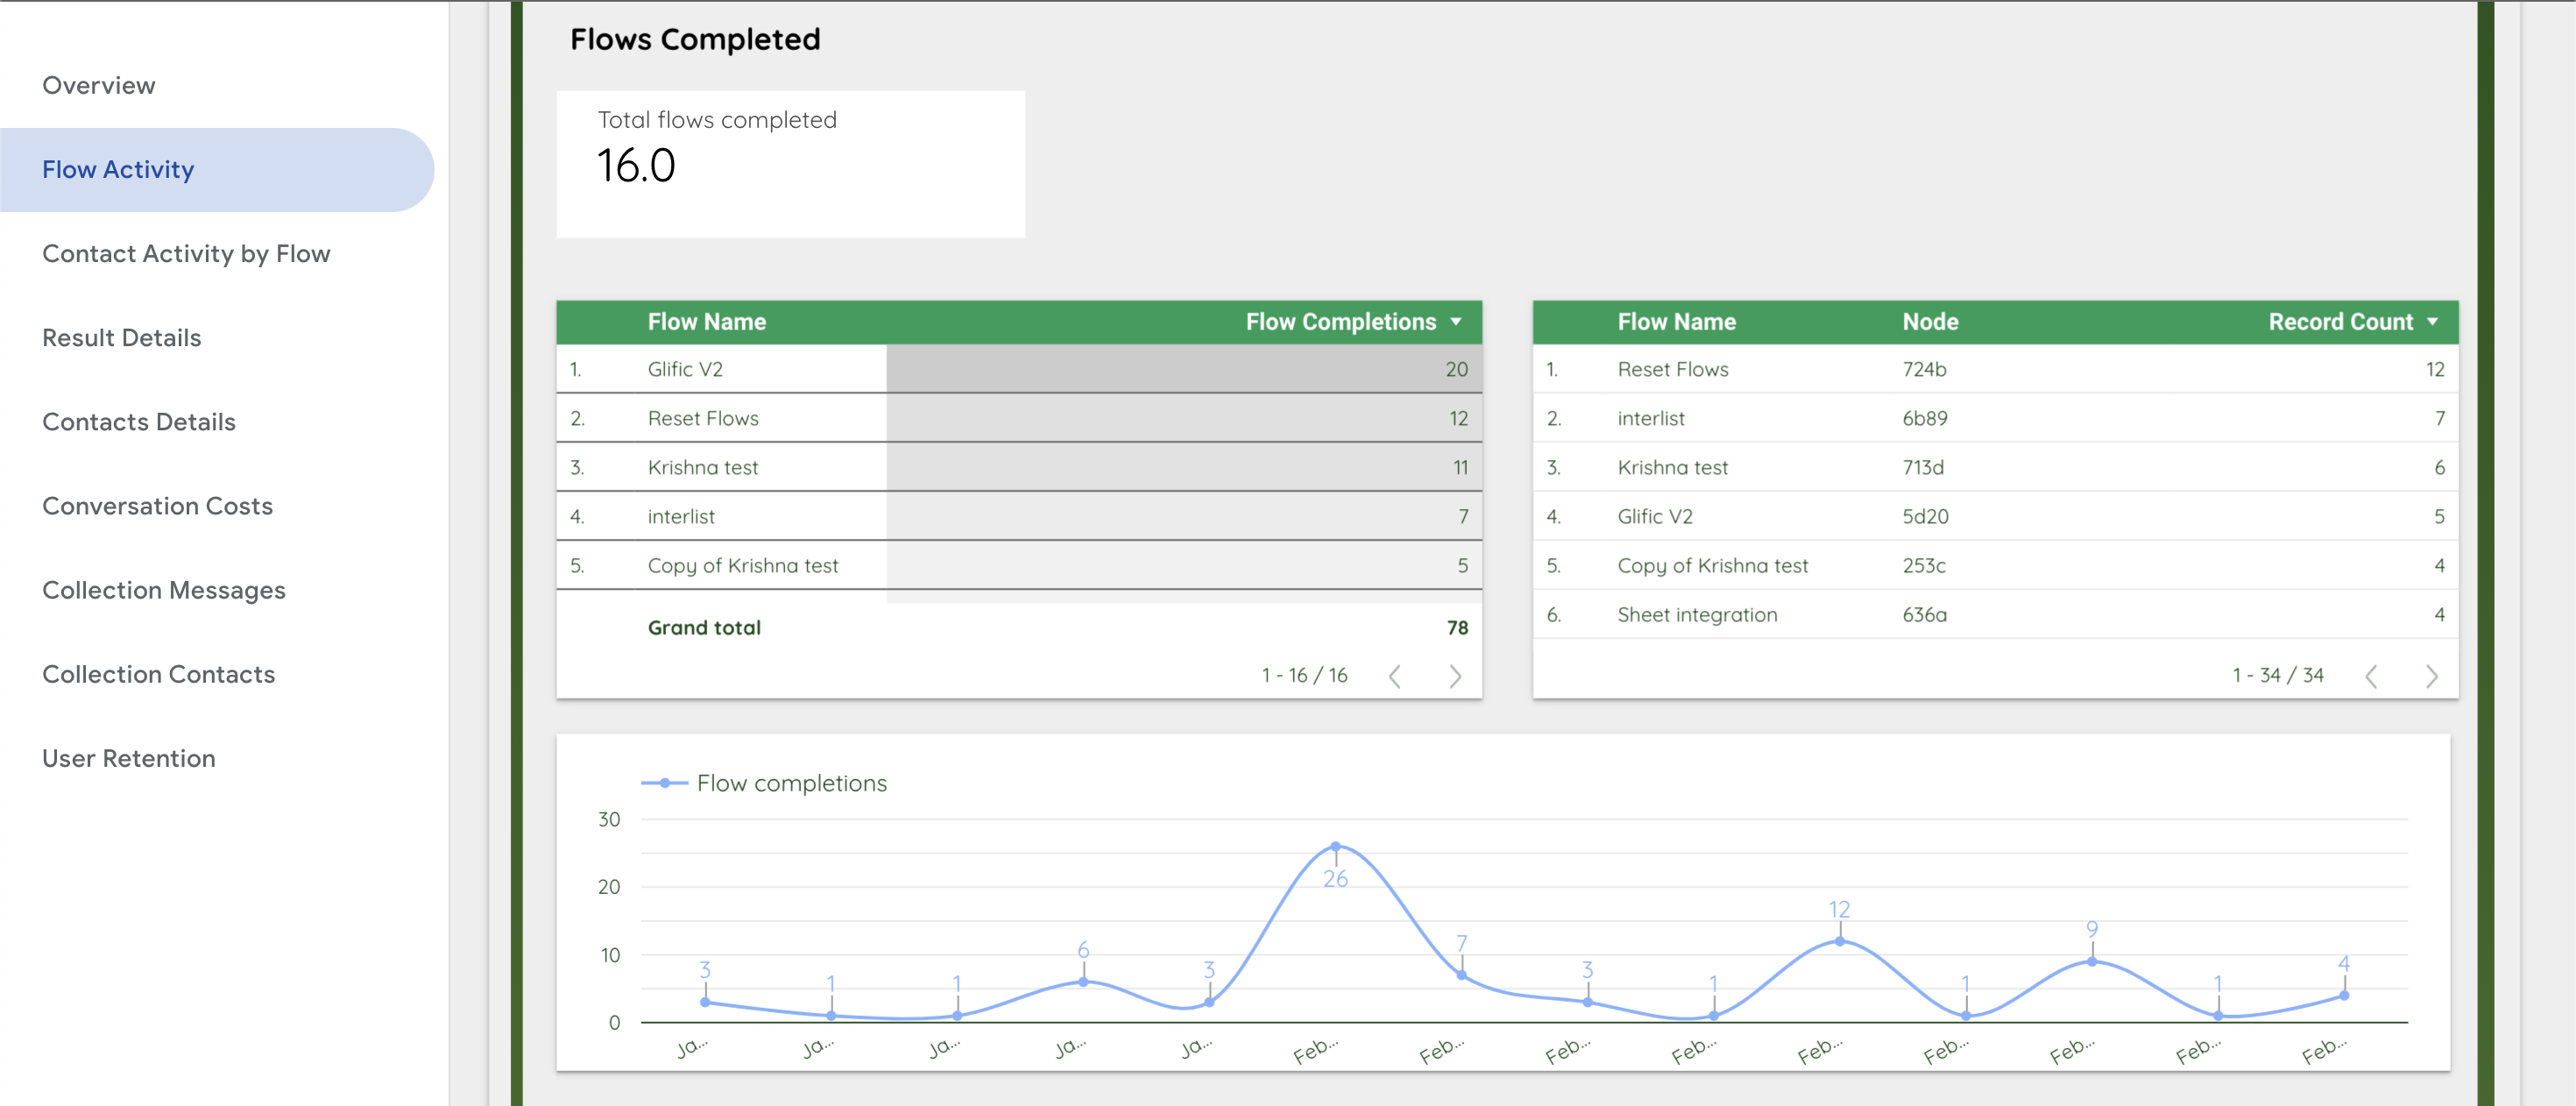
This section will help you understand how often and how your flows are being completed.
- Total flows completed: A count of the unique flows selected.
- Flow completions table: A list of the selected completed flows and the number of times it has been completed.
- Flow completed node table: A list of the completed flows, the node at which the flow was completed, and the number of times that node was reached.
- Flow completion graph: The daywise trend of flows completed during the selected time period.
Incomplete and Killed Flows
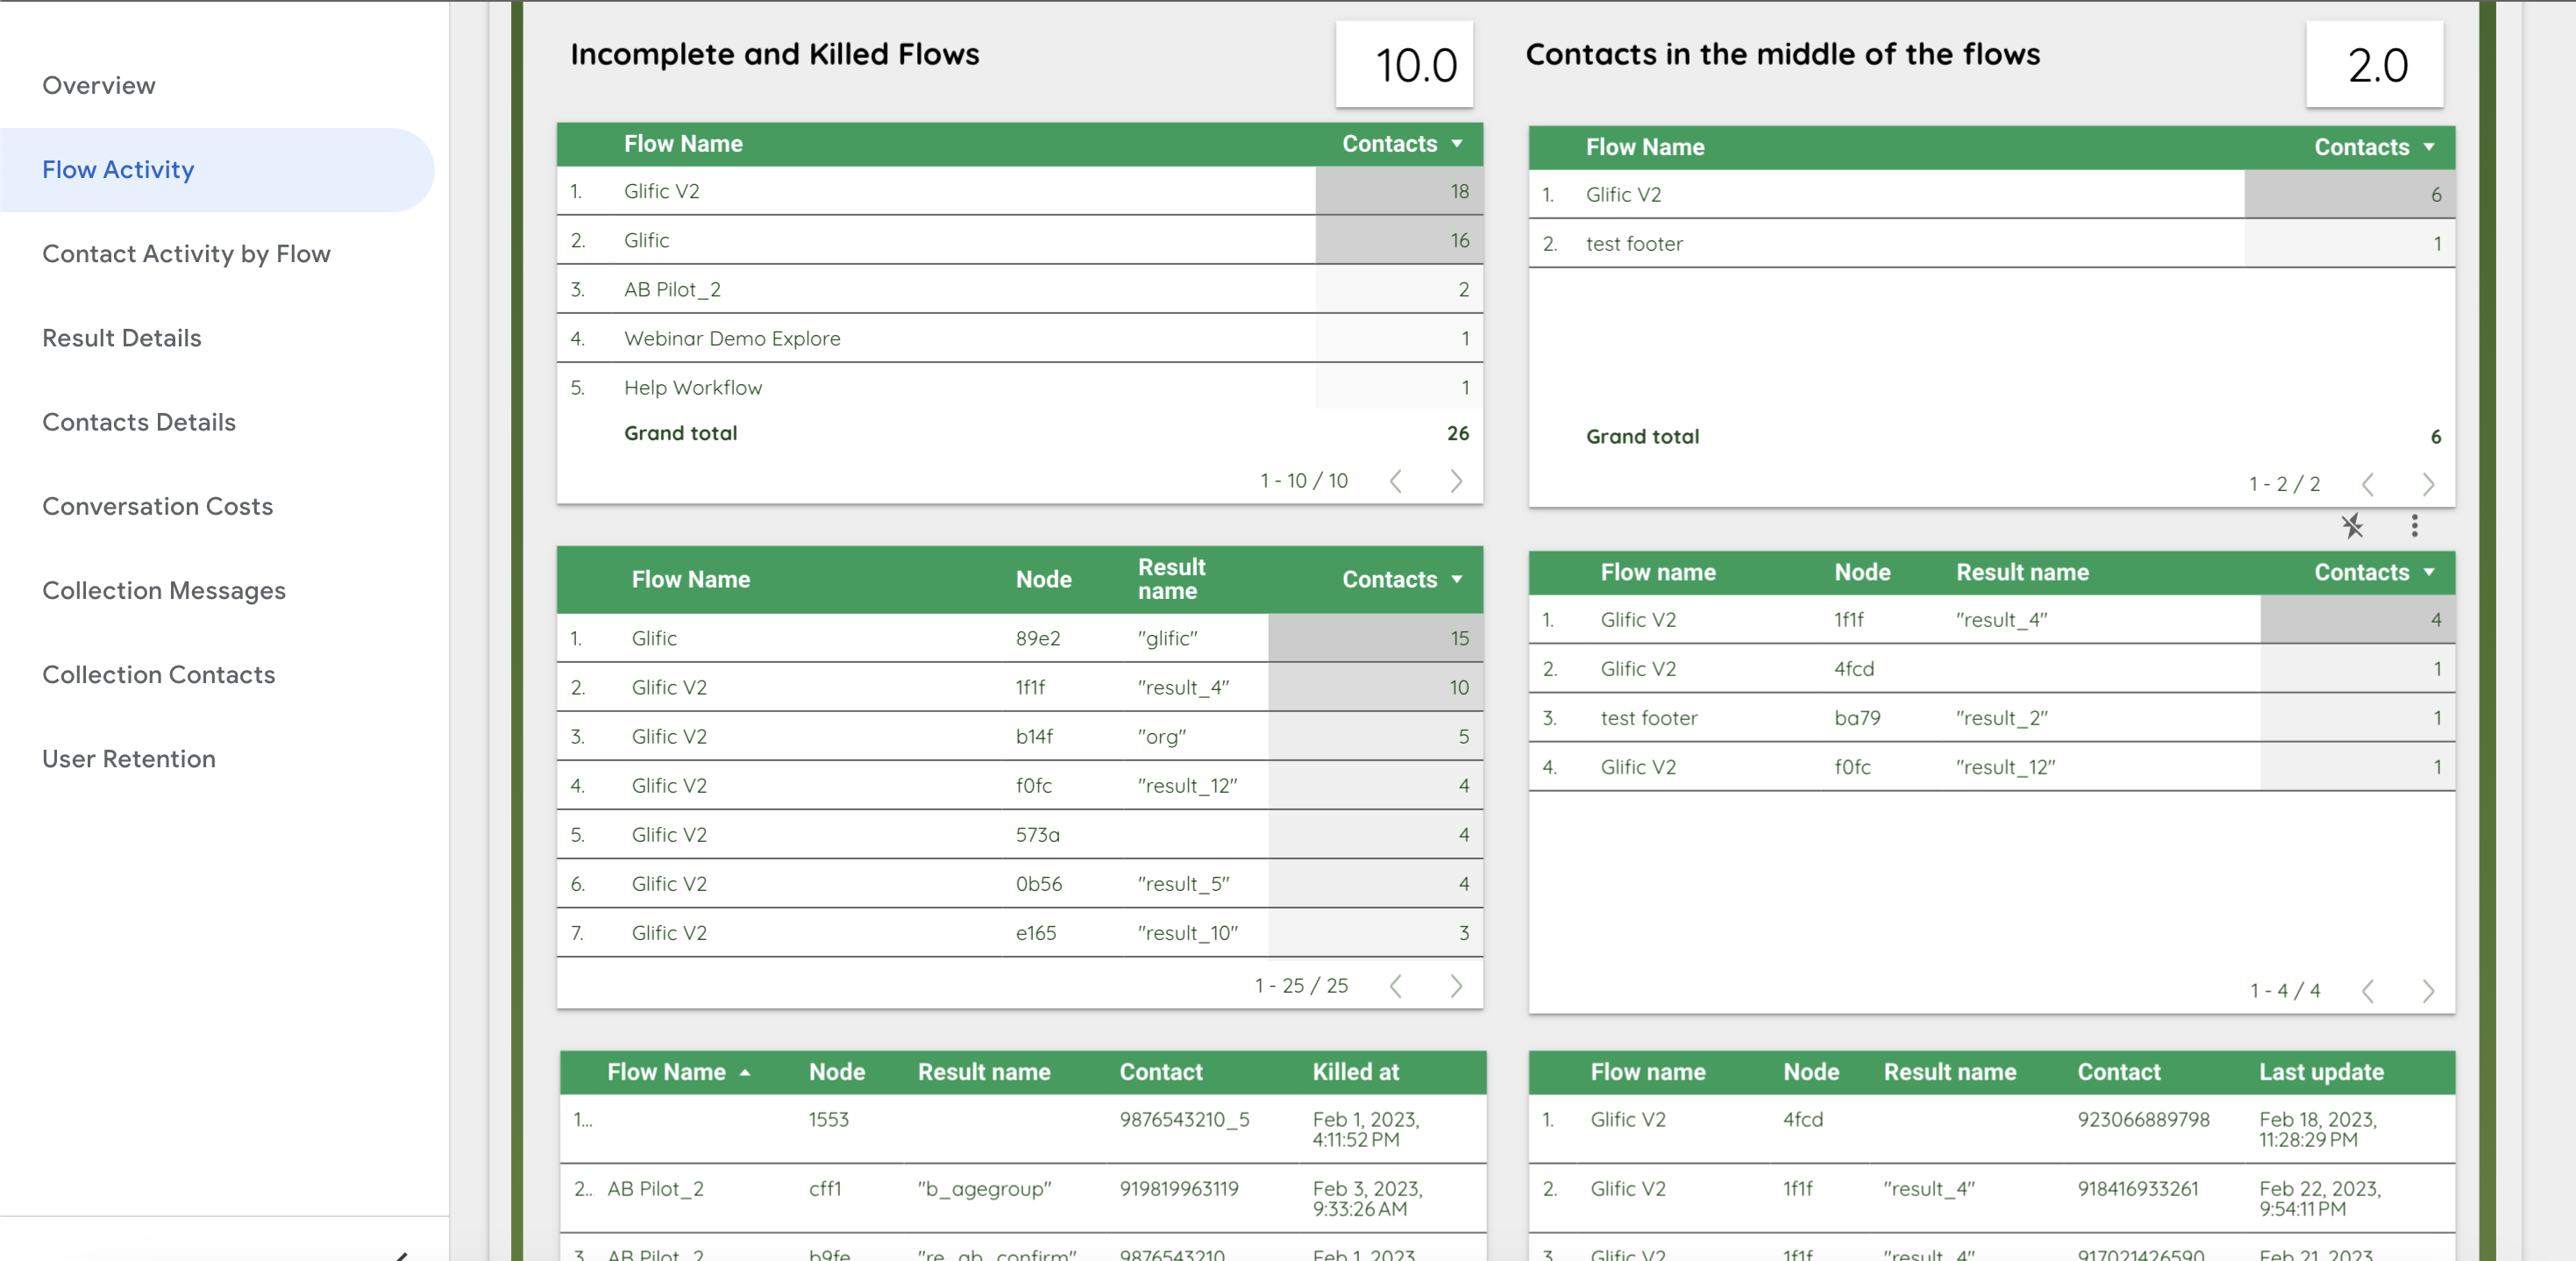
This section helps you investgate which flows have been killed, at which node, and for which contact. Flows can be killed if contacts do not respond for 7 days, if a webhook fails, if they fall into an infinite loop, or if you manually terminate the flow. Using this you can identify where and how to improve your flows.
- Total incomplete and killed flows: The number in the box indicated the count of unique flows that have been killed for some contacts.
- Flow name table: The list of killed flows out of the flows that you have selected and the number of contacts for whom the flow is killed.
- Node and result table: The list of killed flows, the node, associated result name and number of contacts for whom the flow was killed.
- Contact list table: The list of phone numbers and the point at which the flow was killed. Using this you can investigate your flow and their chat on Glific to understand the problem further.
Contacts in the Middle of Flows
This section is structured the same was as the previous one. It will tell you about flows which contacts have not completed, which node they are at, and who the contacts are.
3. Contact Activity by Flow
This page has been created to give you information about your contacts. It is divided into 3 broad sections, described below. This page has a date range filter, a flow name filter, and a flow label filter which allows you to see data for a specific flow/flow label during a specific time period. Using labels to track engagement is an important part of flow design.
This is an important page to gather user information and data points for activity in specific flows.
Total Contacts and Messages by Flow name/Flow Label
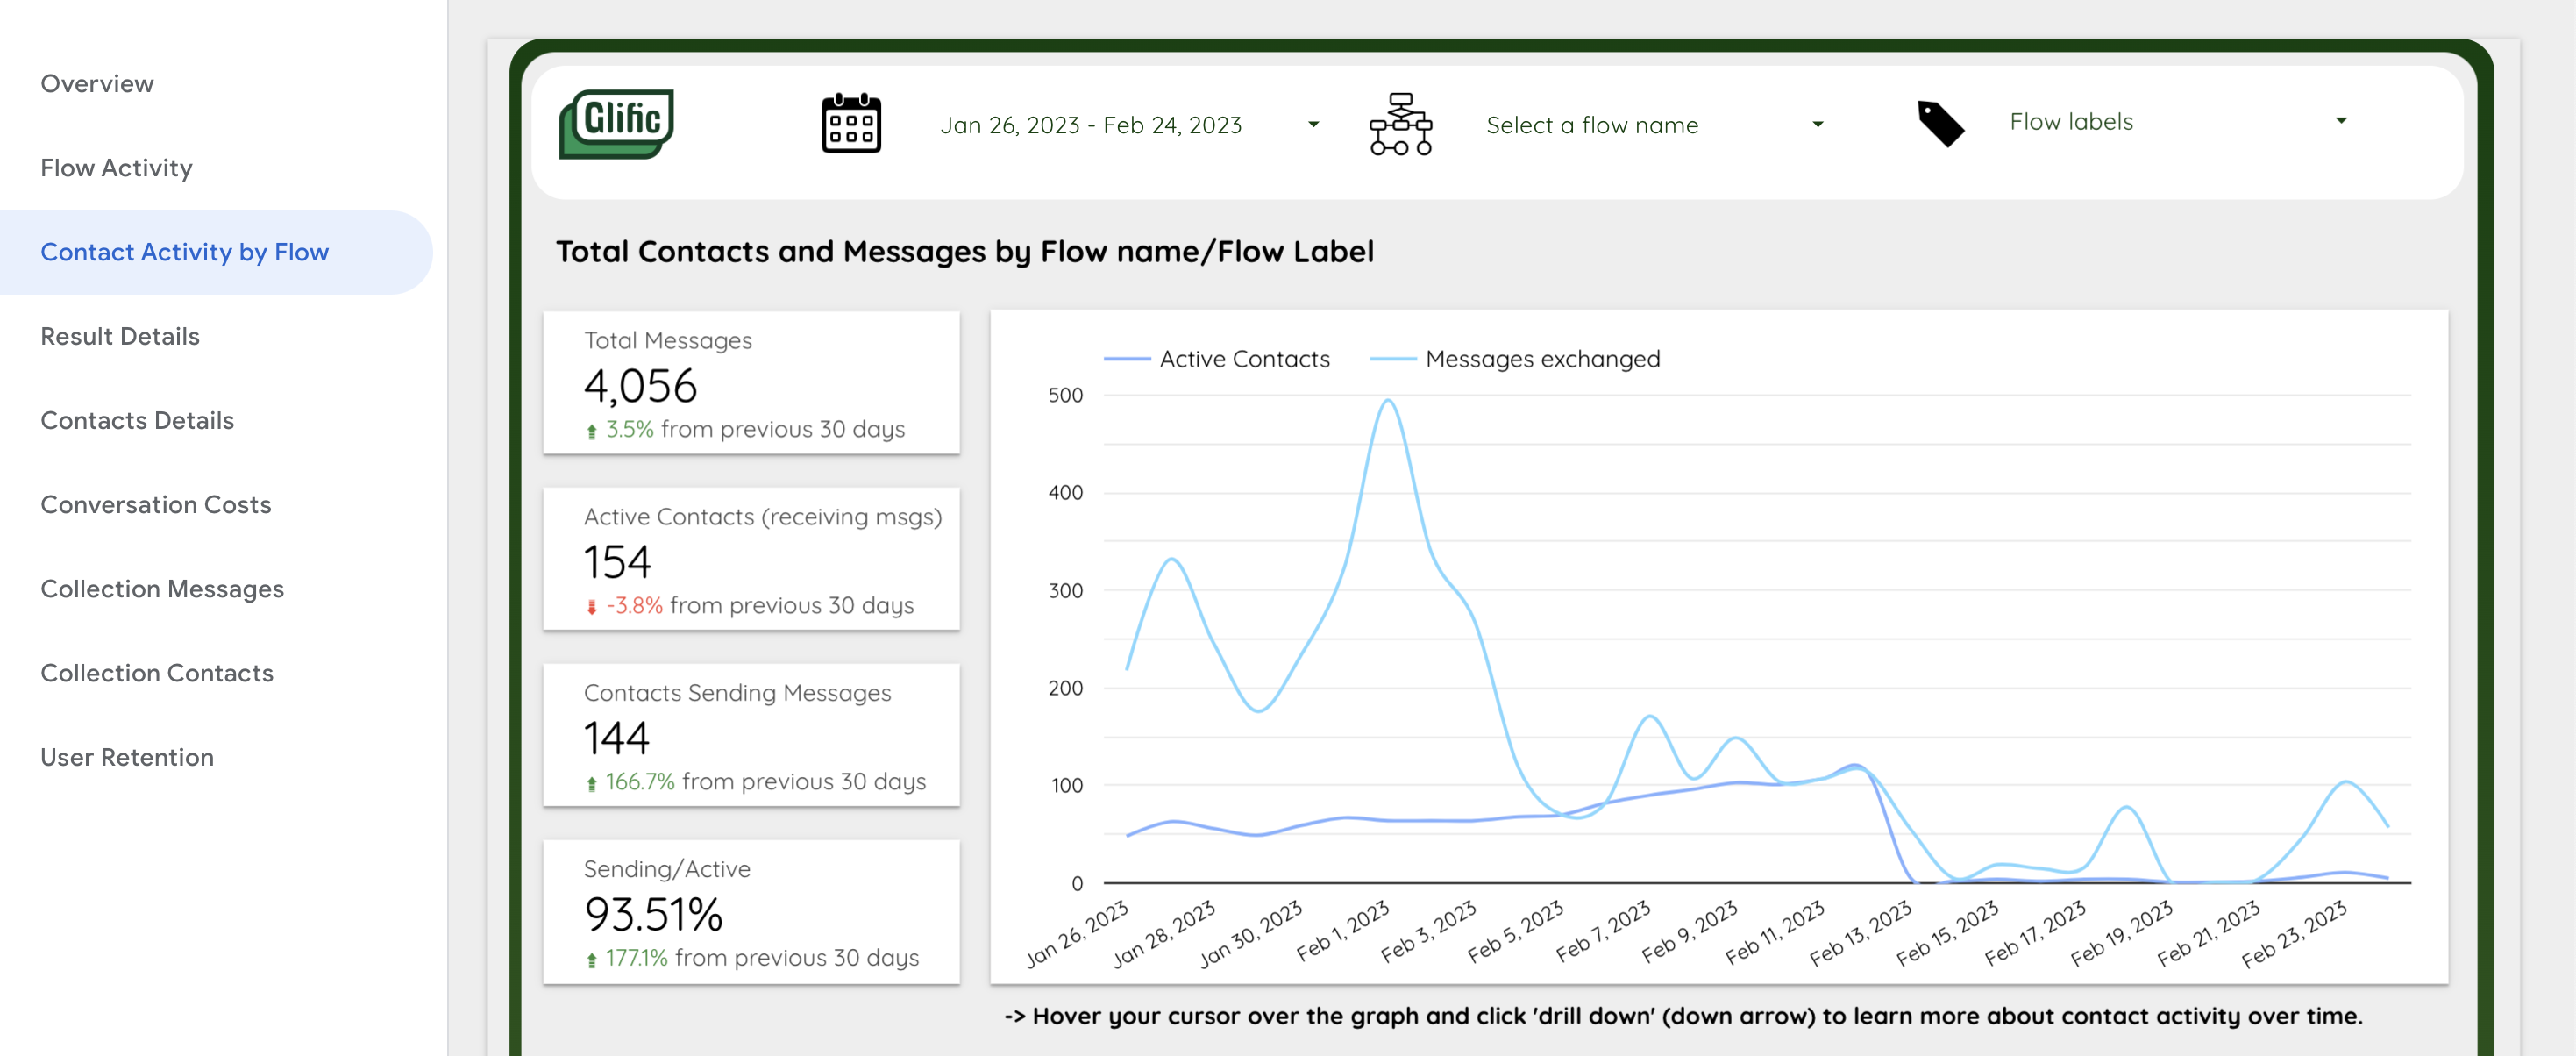
This section is the same as the the stakeholder engagement overview section in the overview page, with the key difference being that you can filter and check engagement for specific flows.
Contact Details by Flow Label
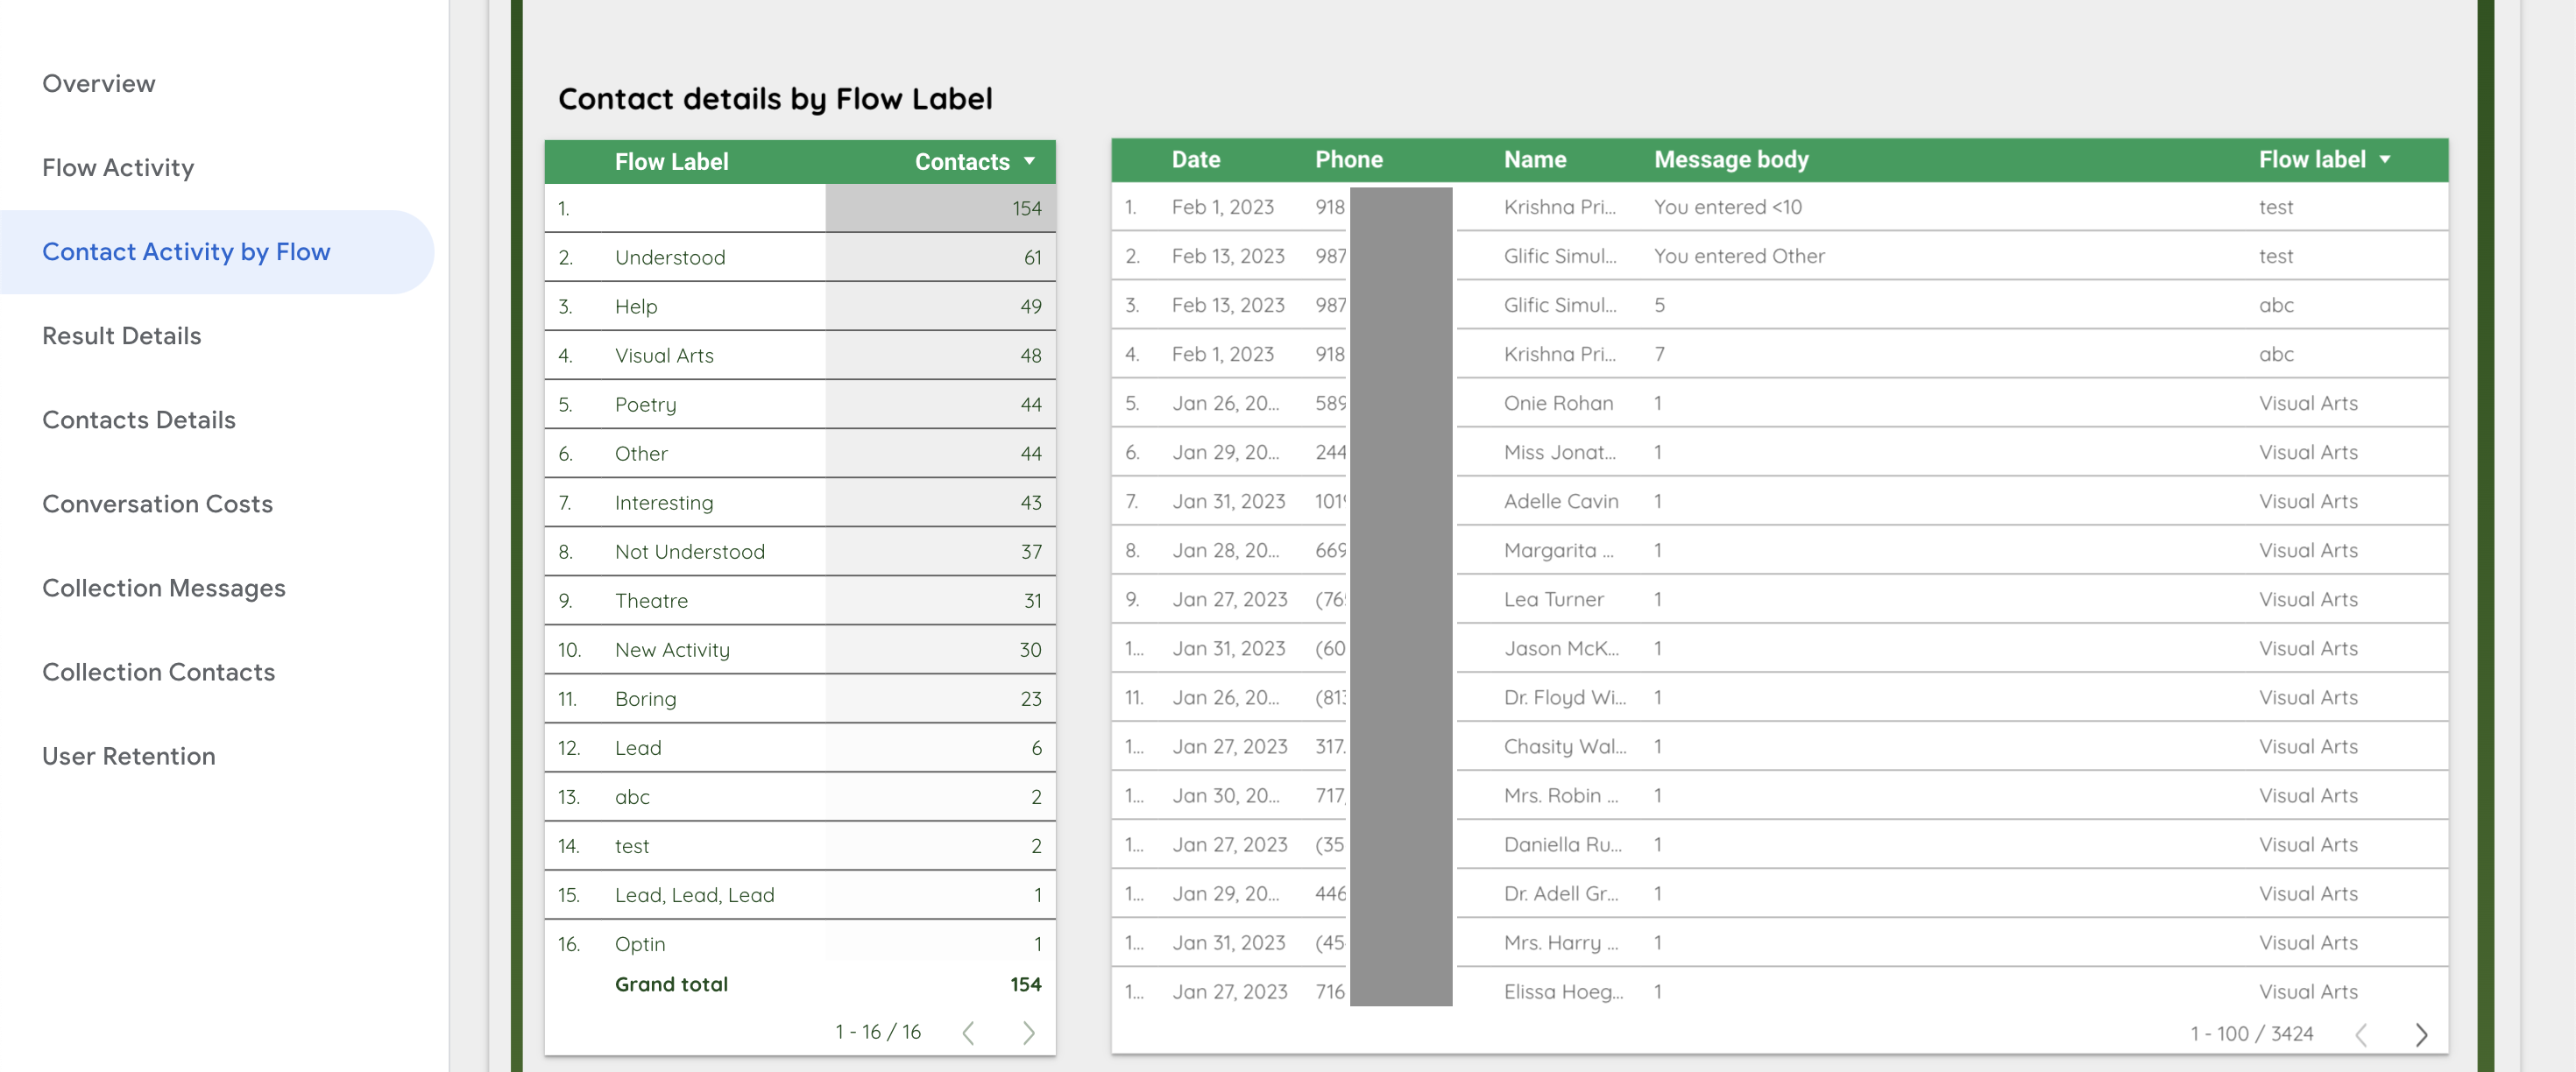
This section allows you to see the contact activity for each of the listed flow labels for a specific flow or of flow labels selected, depending on how you use the filters.
- Flow label & contacts table: Displays all the associated flow labels as per your filter and the count of contacts tagged with that label.
- Flow label and messages table: Displays the flow label, contact, and associated message as per your selected filters.
Contact Activity
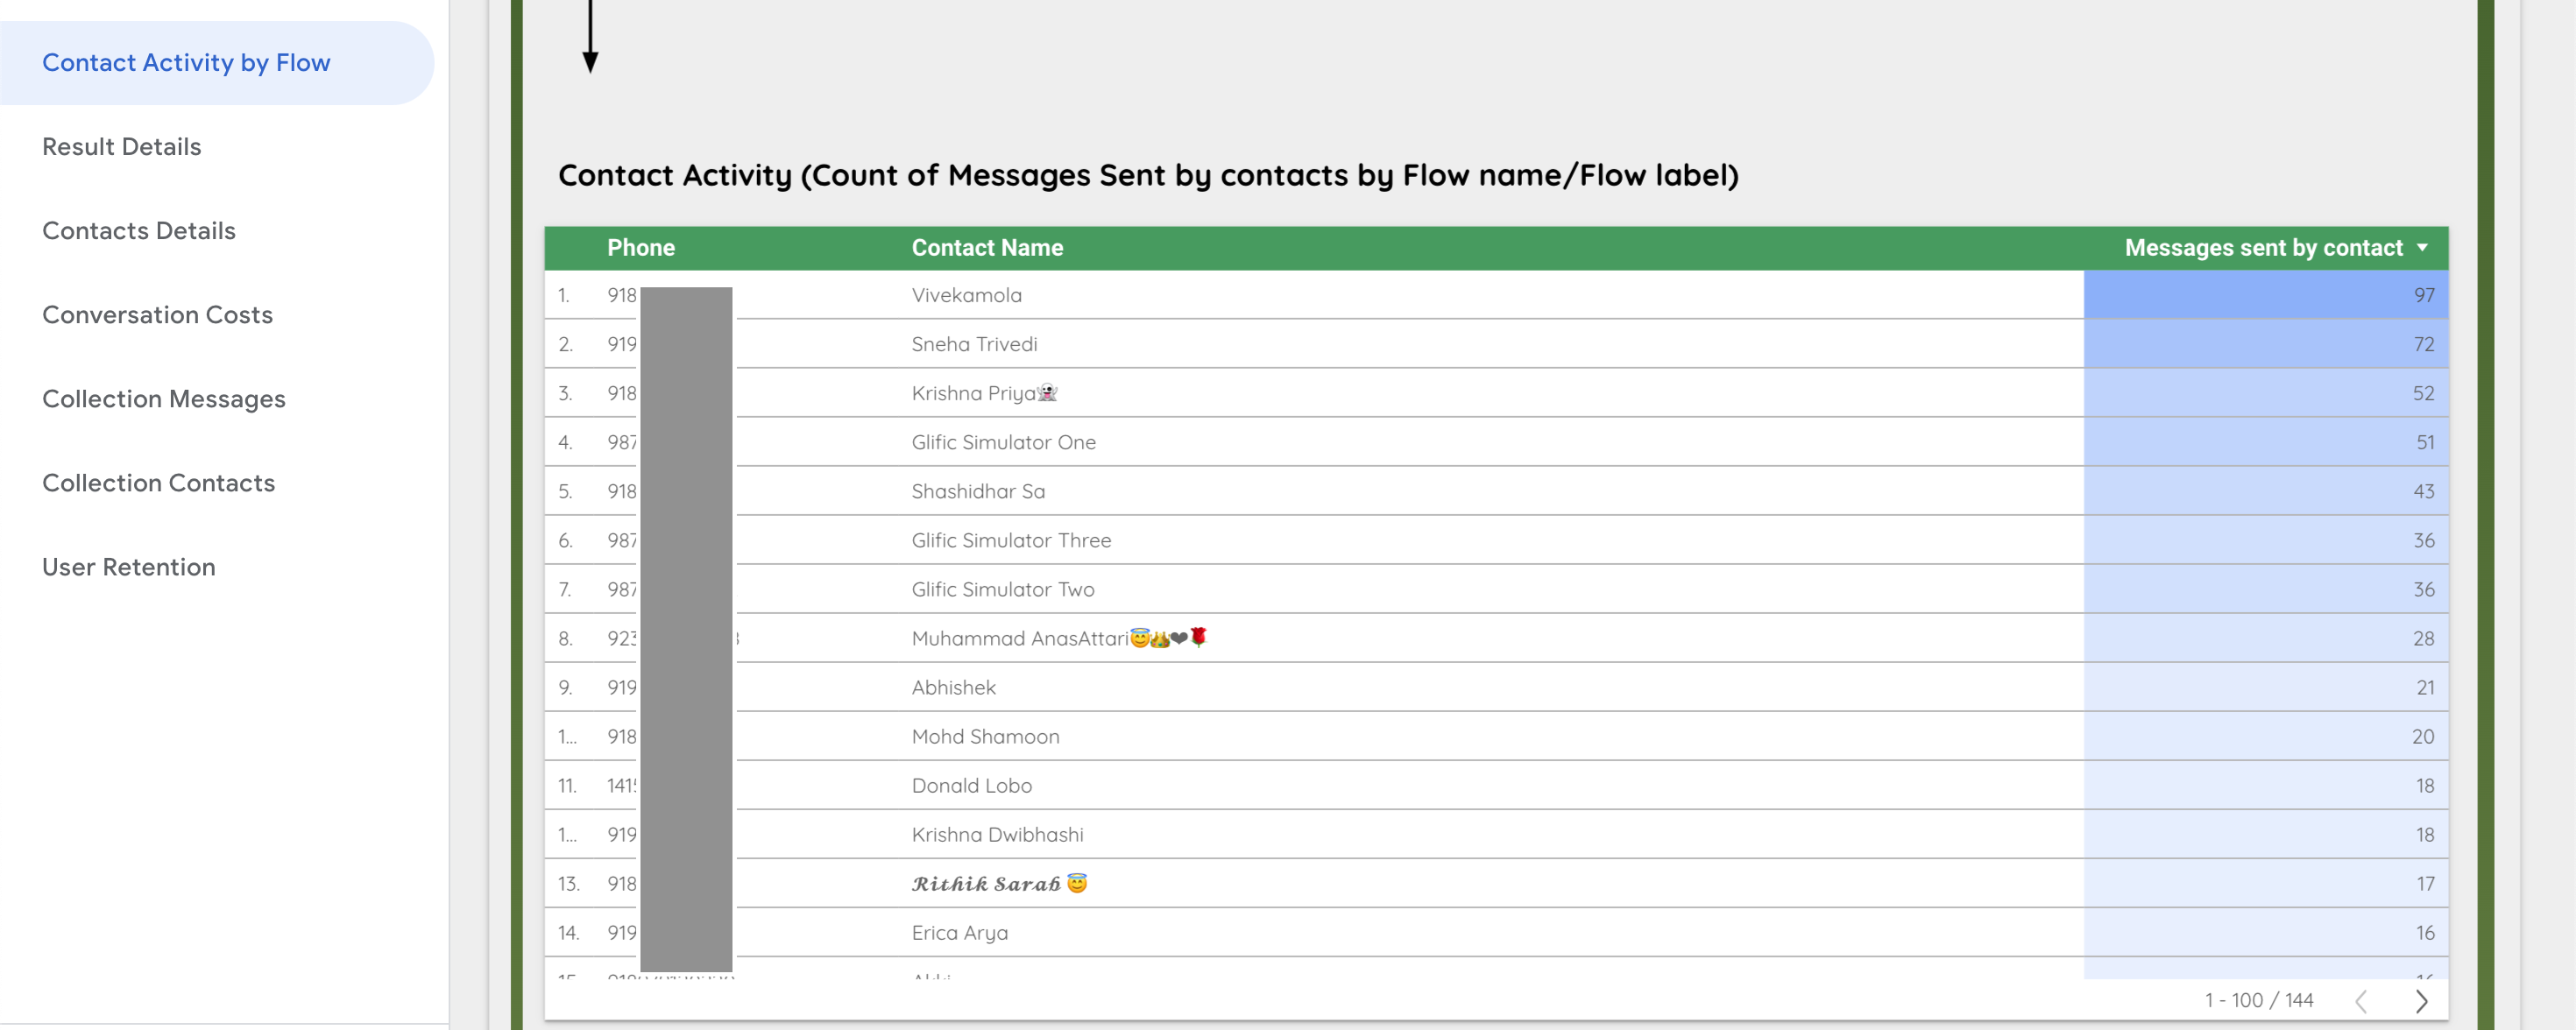
This section comprises of 1 table which will give you a list of every contact for selected flows or flow labels and show you how many messages the contact has sent during the selected time period. It is arranged for you to see your most active contact at the top.
4. Result Details
This page gives you all the information stored in your flow variables which we create and store with '@results'. The page has two sections with one table in each.You can filter this page by date, flow name, and result name.
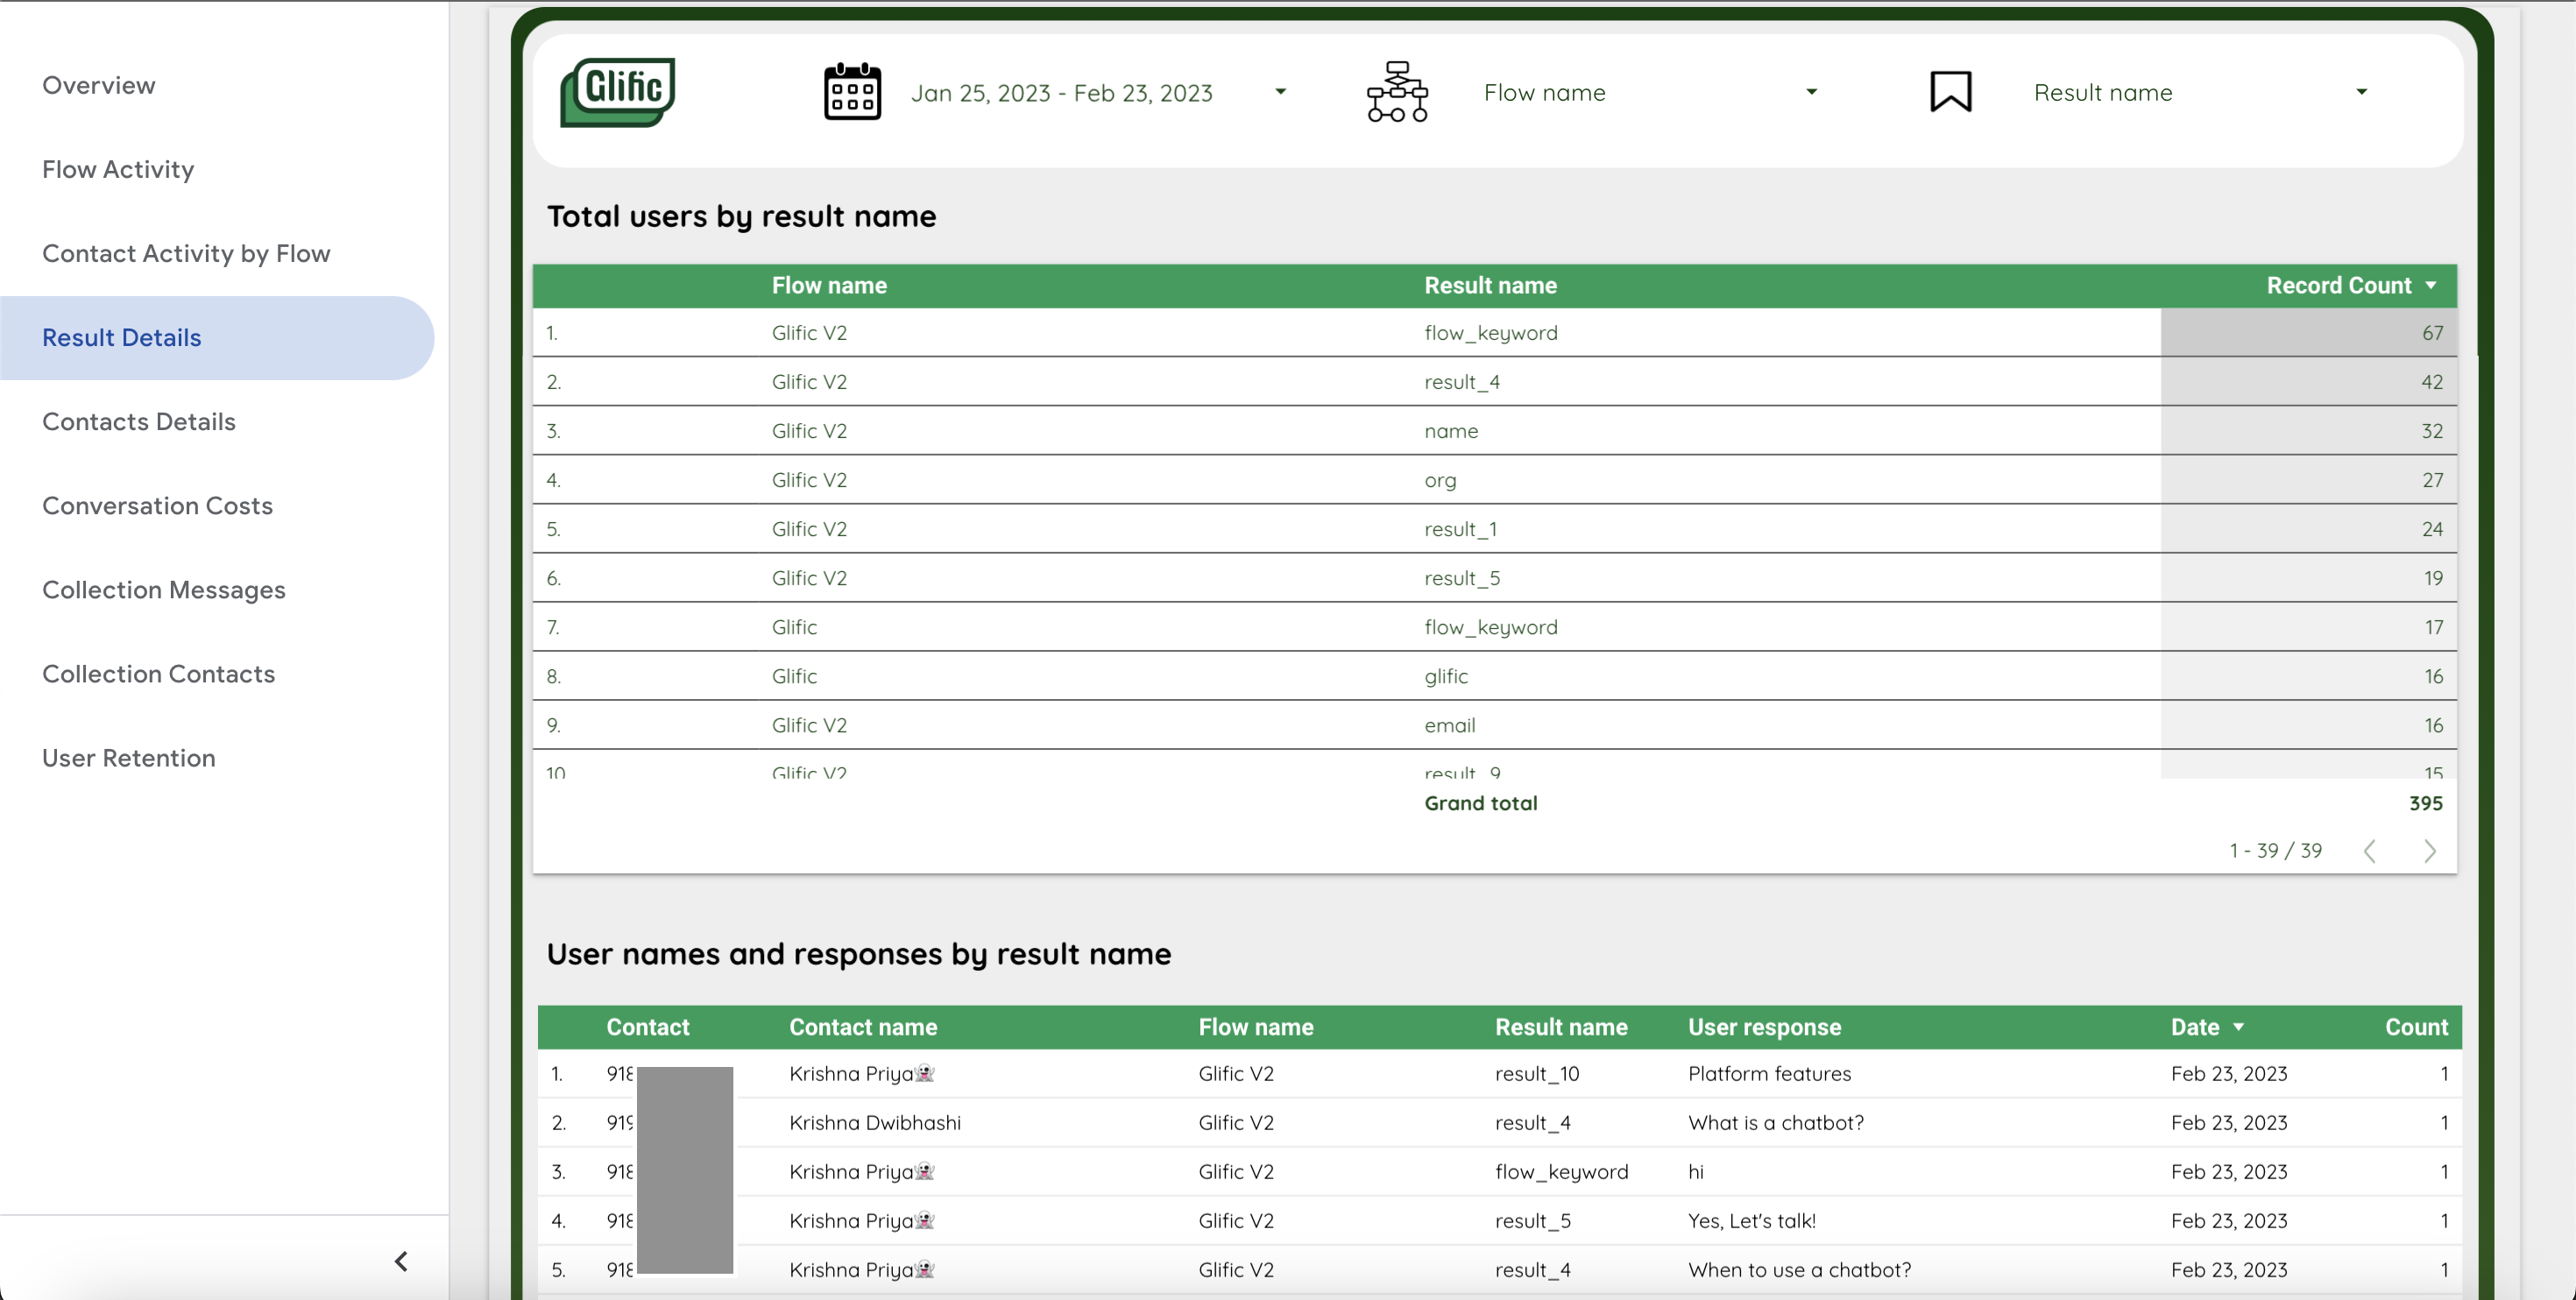
- Total users by result name: Describes the number of times a value has been stored in a result/flow variable for a specific flow.
- User names and responses by result name: Gives you the list of contacts, when they passed through the node and what value was saved in the result/flow variable.
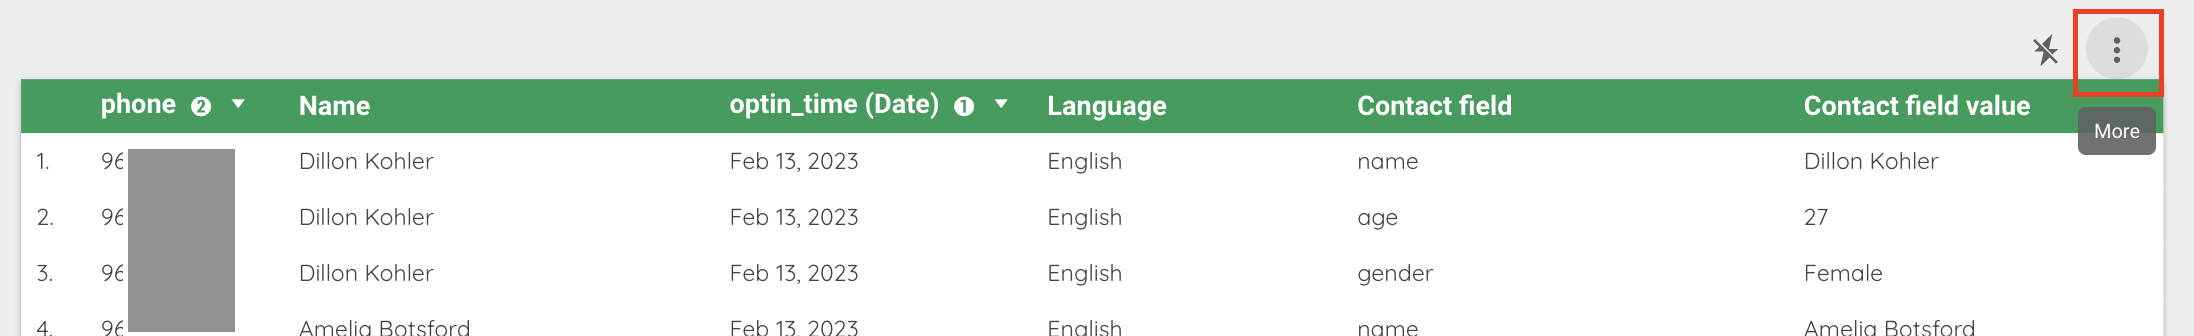
5. Contact Details
This page is where you will find all the contact details that you have stored in contact fields. This page has 5 visuals, described below. This page allows you to filter by contact name, phone number, contact field, and date.
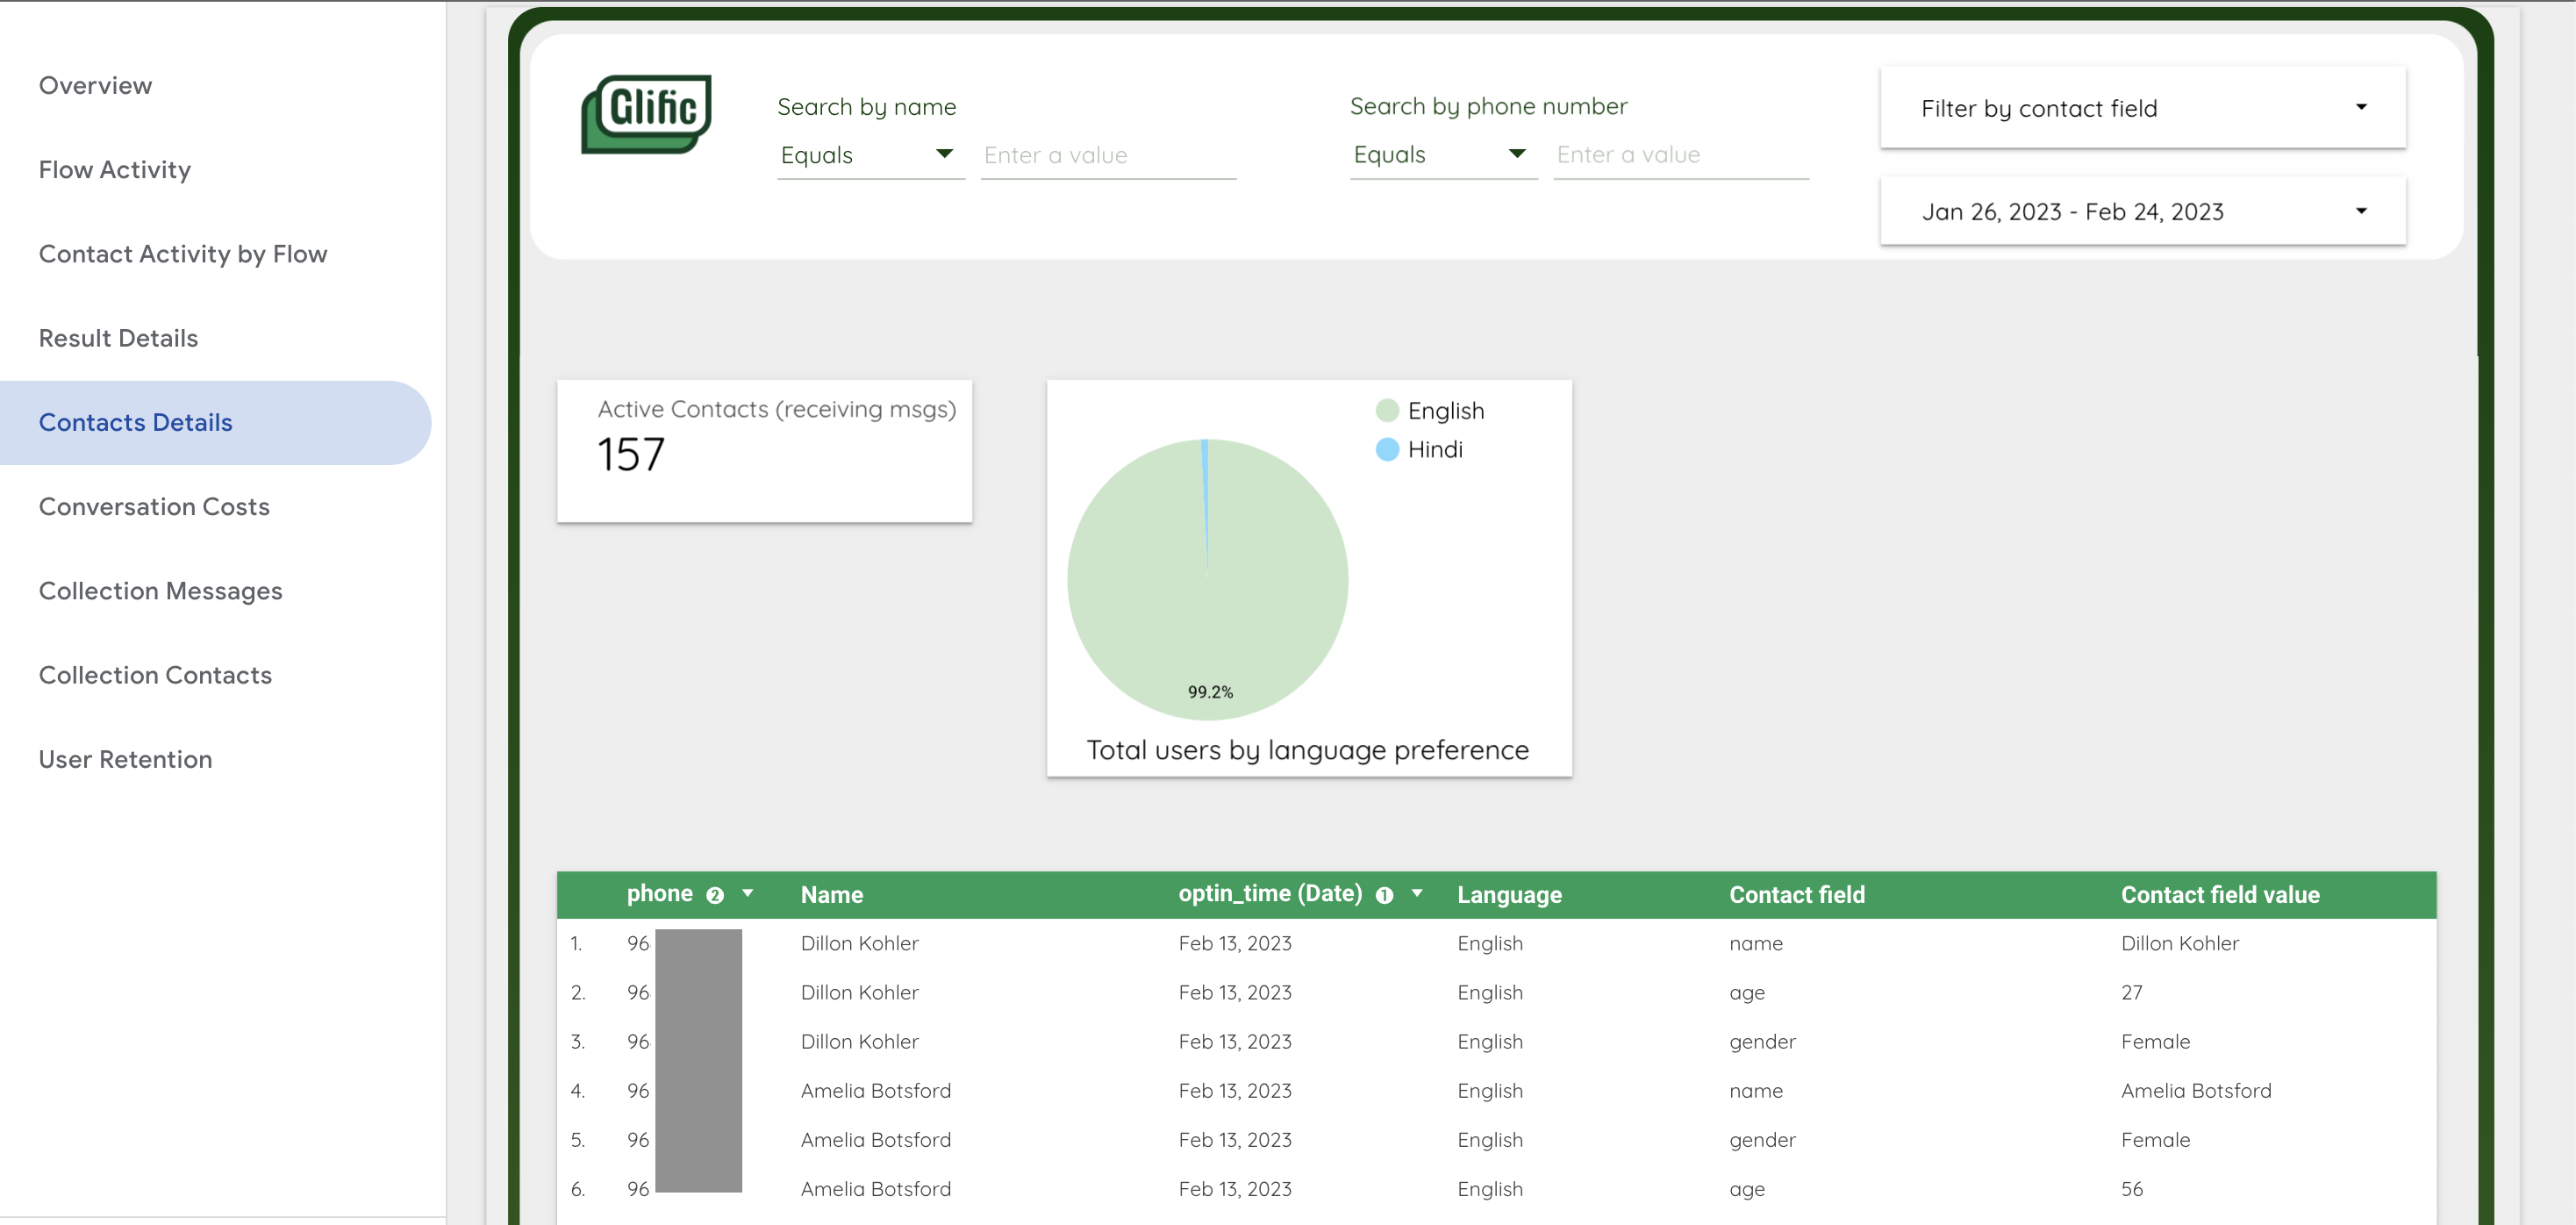
- Active Contacts(recieving messages): A count of all the contacts stored who have recieved messages in the selected time period.
- Total users by language preference: Shows you the distribution of contacts for those contacts who have their language preference updated on your system.
- Contact List: This table shows you all you contacts, the contact field values that have been created for them and the associated values stored in these contact fields.
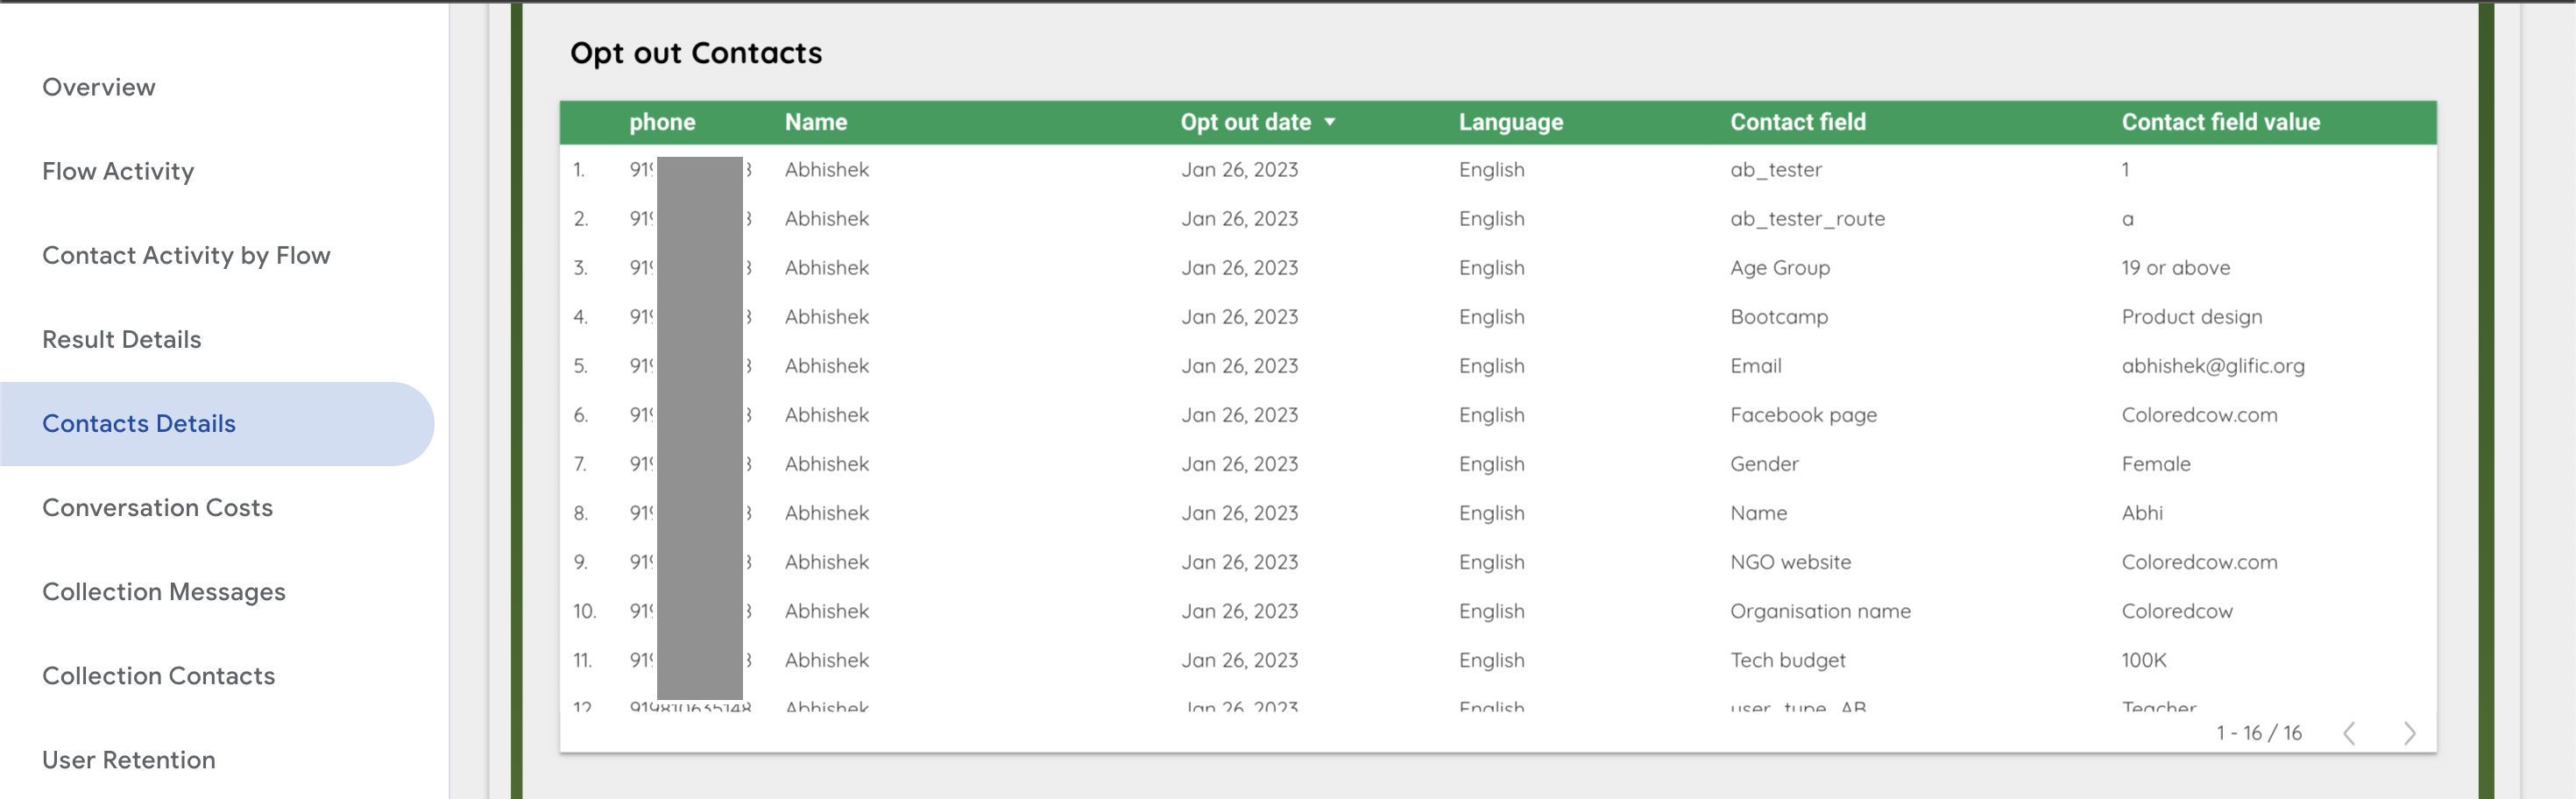
- Opt out Contacts This table shows you the list of all the contacts who have opted out from using your chatbot(i.e. you can no longer send them messages) and their related details.
6. Conversation Costs
You will recieve a monthly invoice from Gupshup based on the messages you exchange and the conversations started. This page provides you with a snapshot of your chatbots activity and associated charges for the selected time period. It is an expansion of the second section of the overview page.
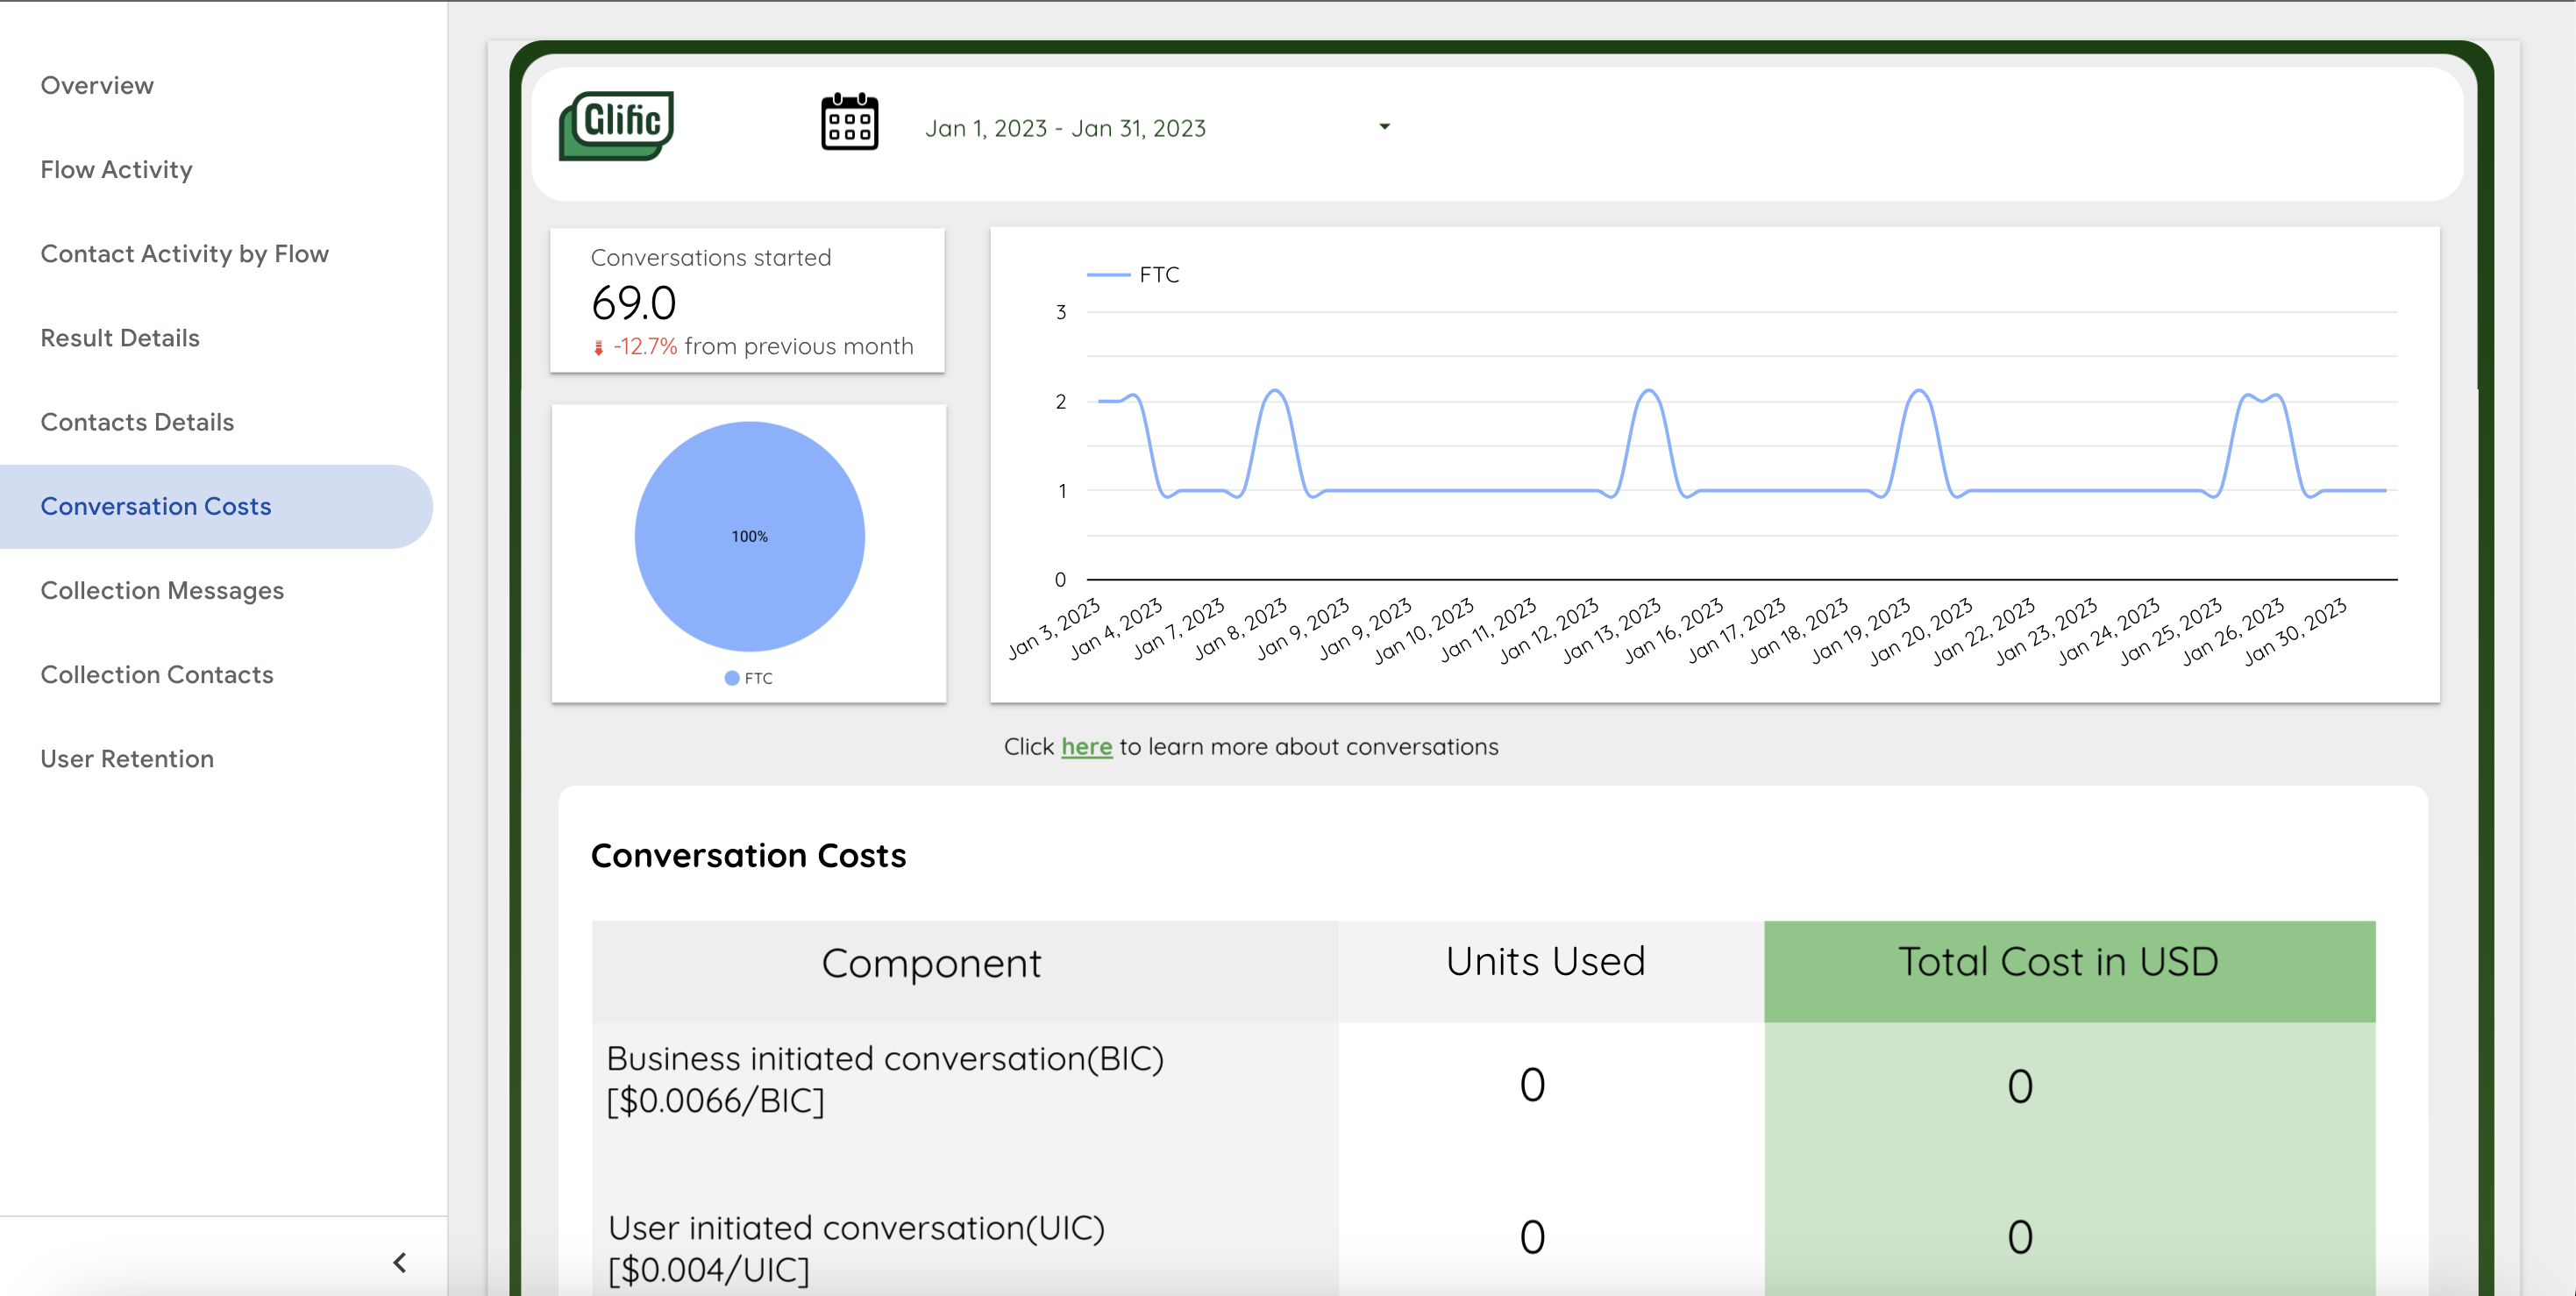
To learn more about charges for the types of conversations and messages mentioned in this sheet refer here.
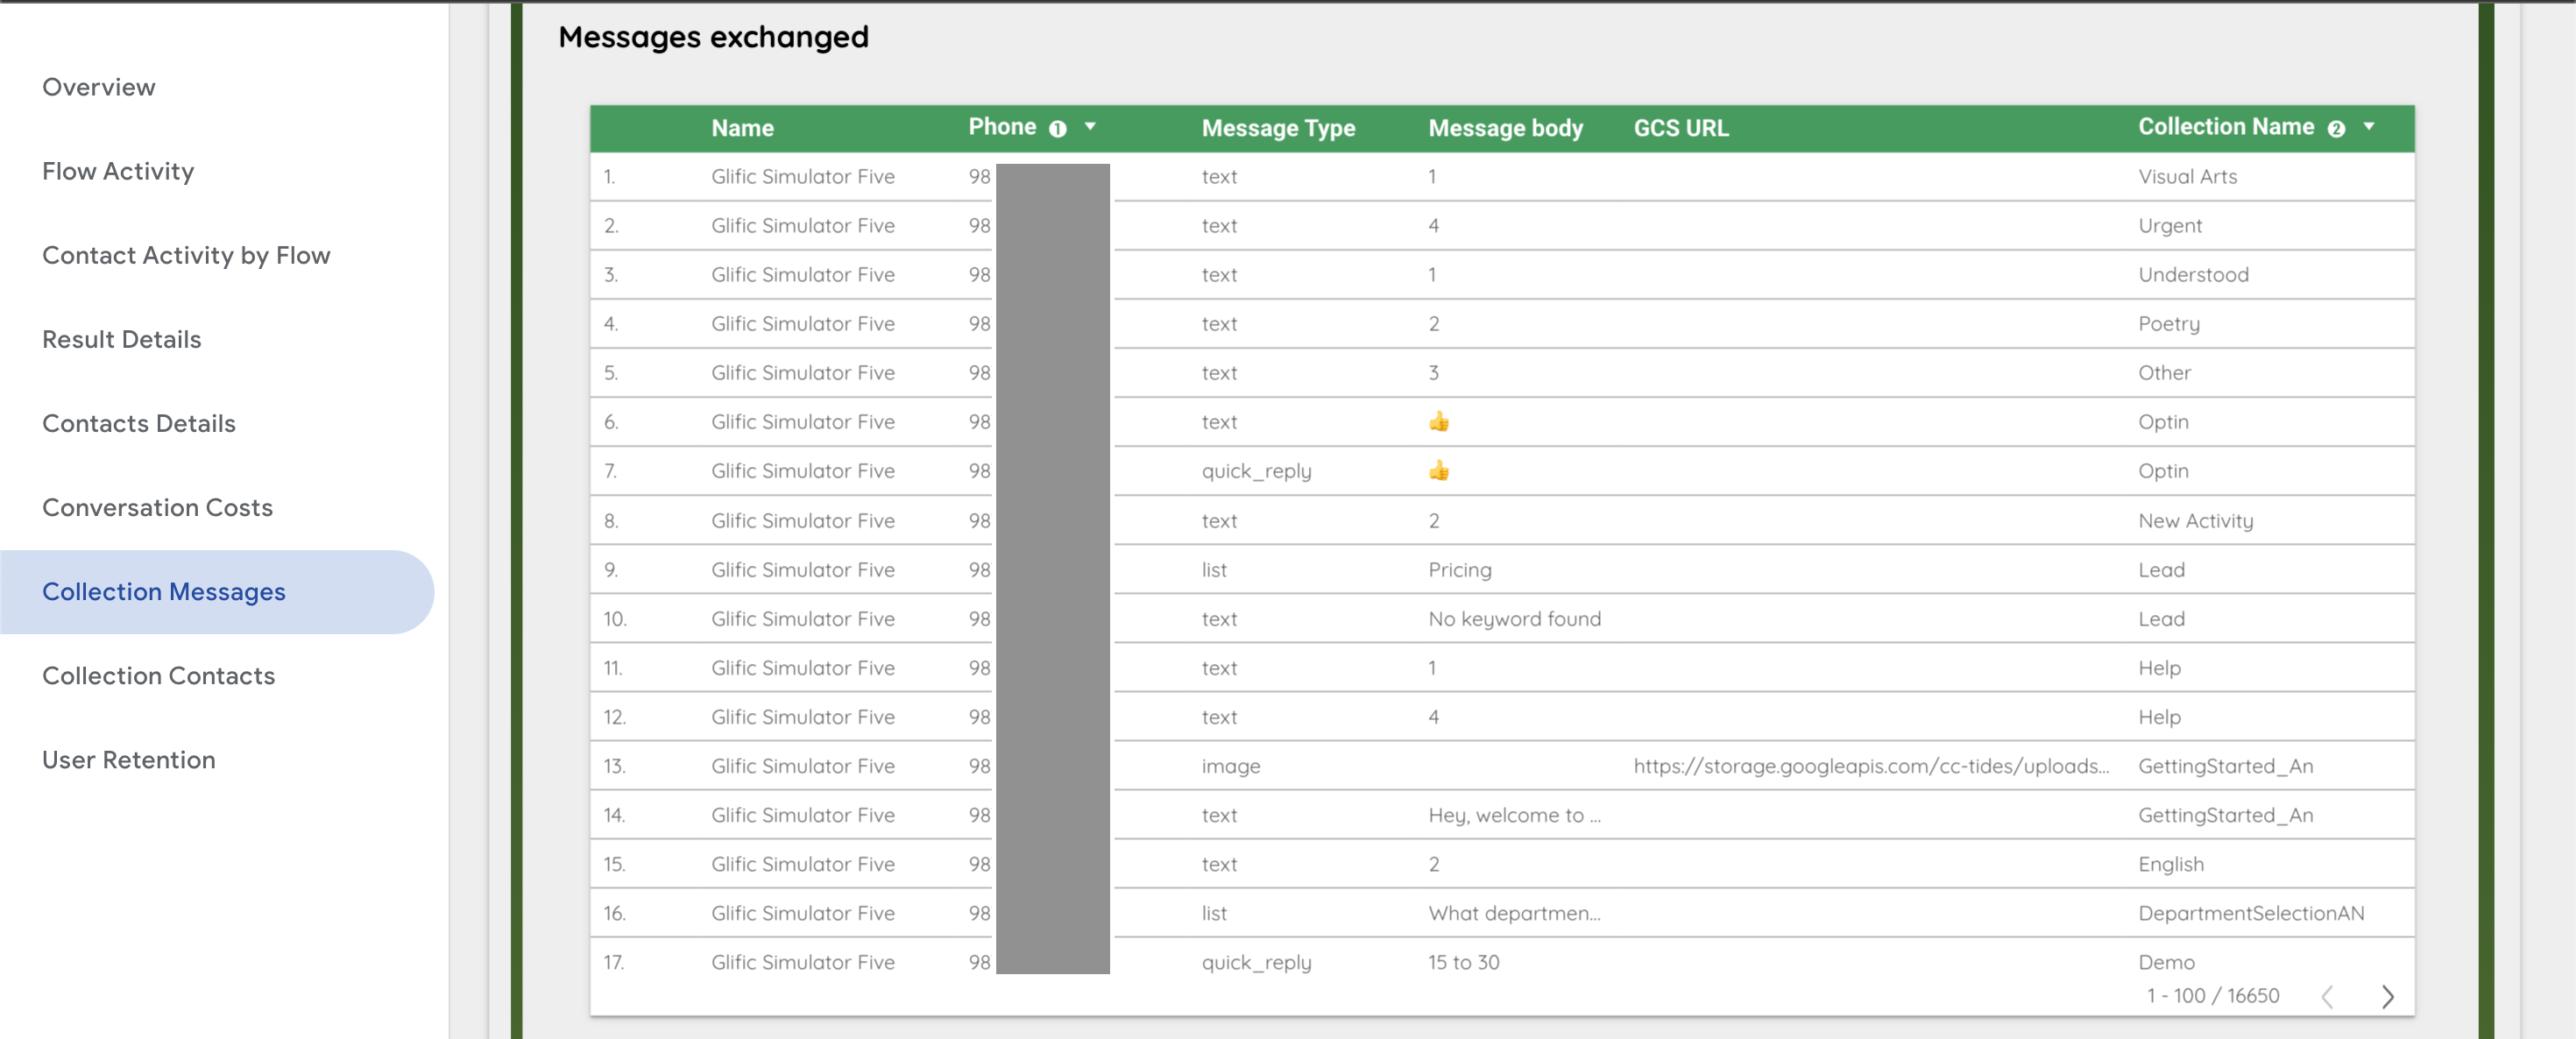
7. Collection Messages
This page allows you to search for your contacts by the collections that they are part of and then check how many and which messages they have exchanged. You can filter this page by date, phone number, and collection name. This page has 2 visuals, described below.
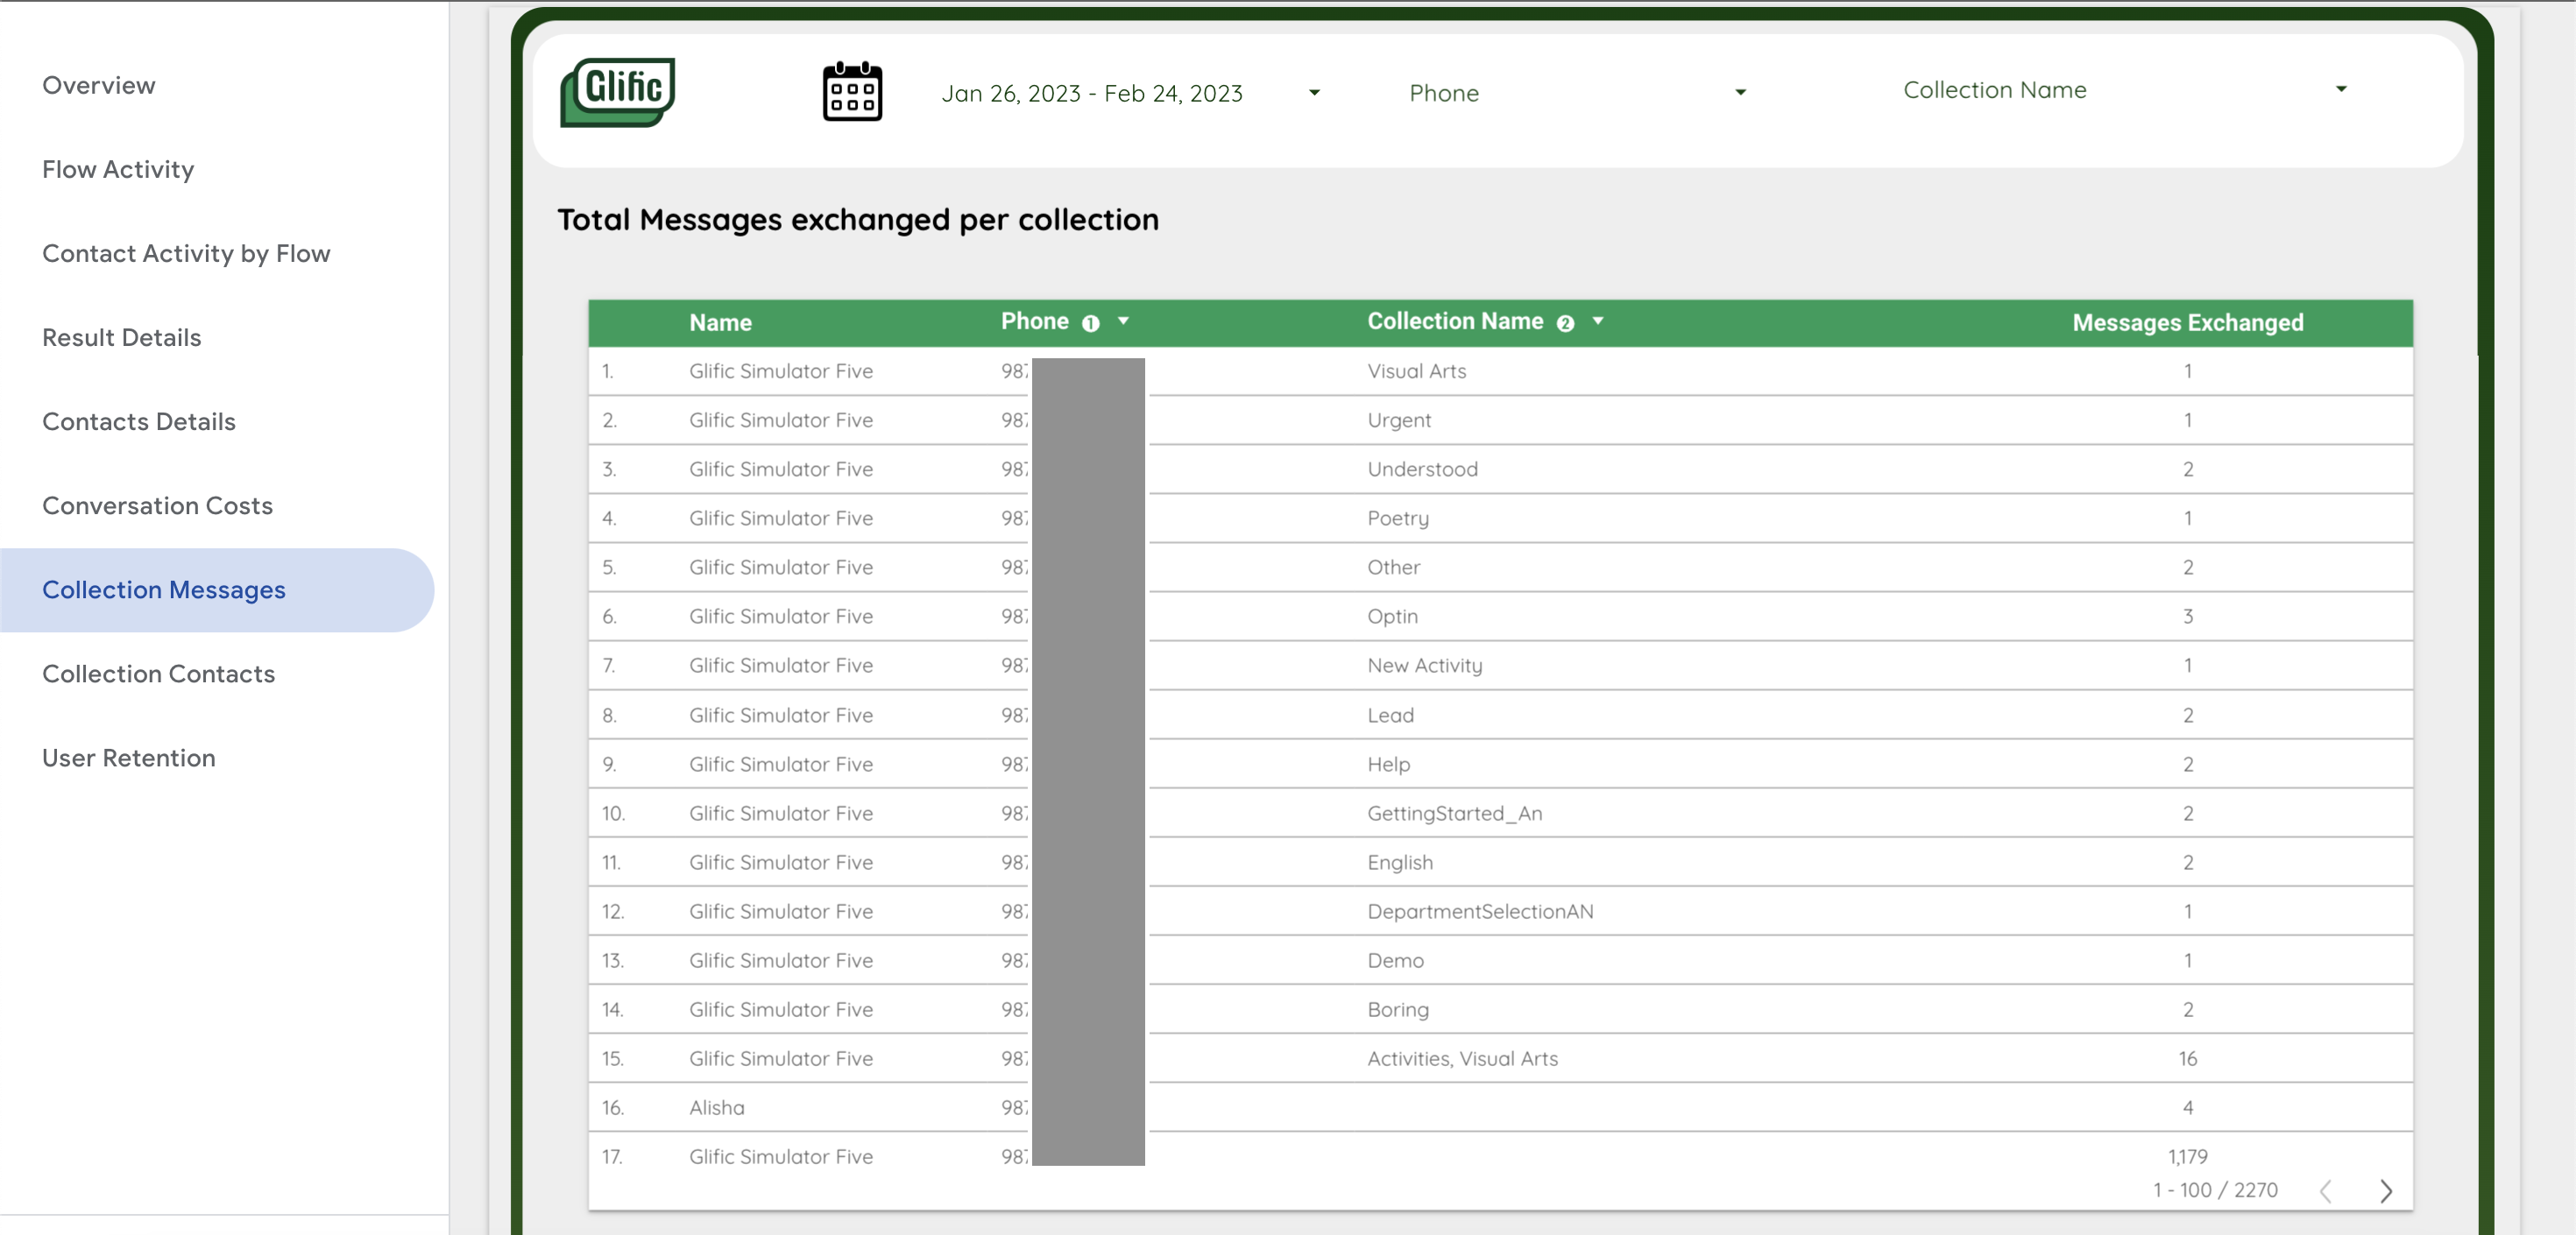
- Total Messages exchanged per collection: A list all the contacts, the collections they belong to and the total messages they have exchanged.
- Messages exchanged: A list of all the messages exchanged by each contact in the selected collections.
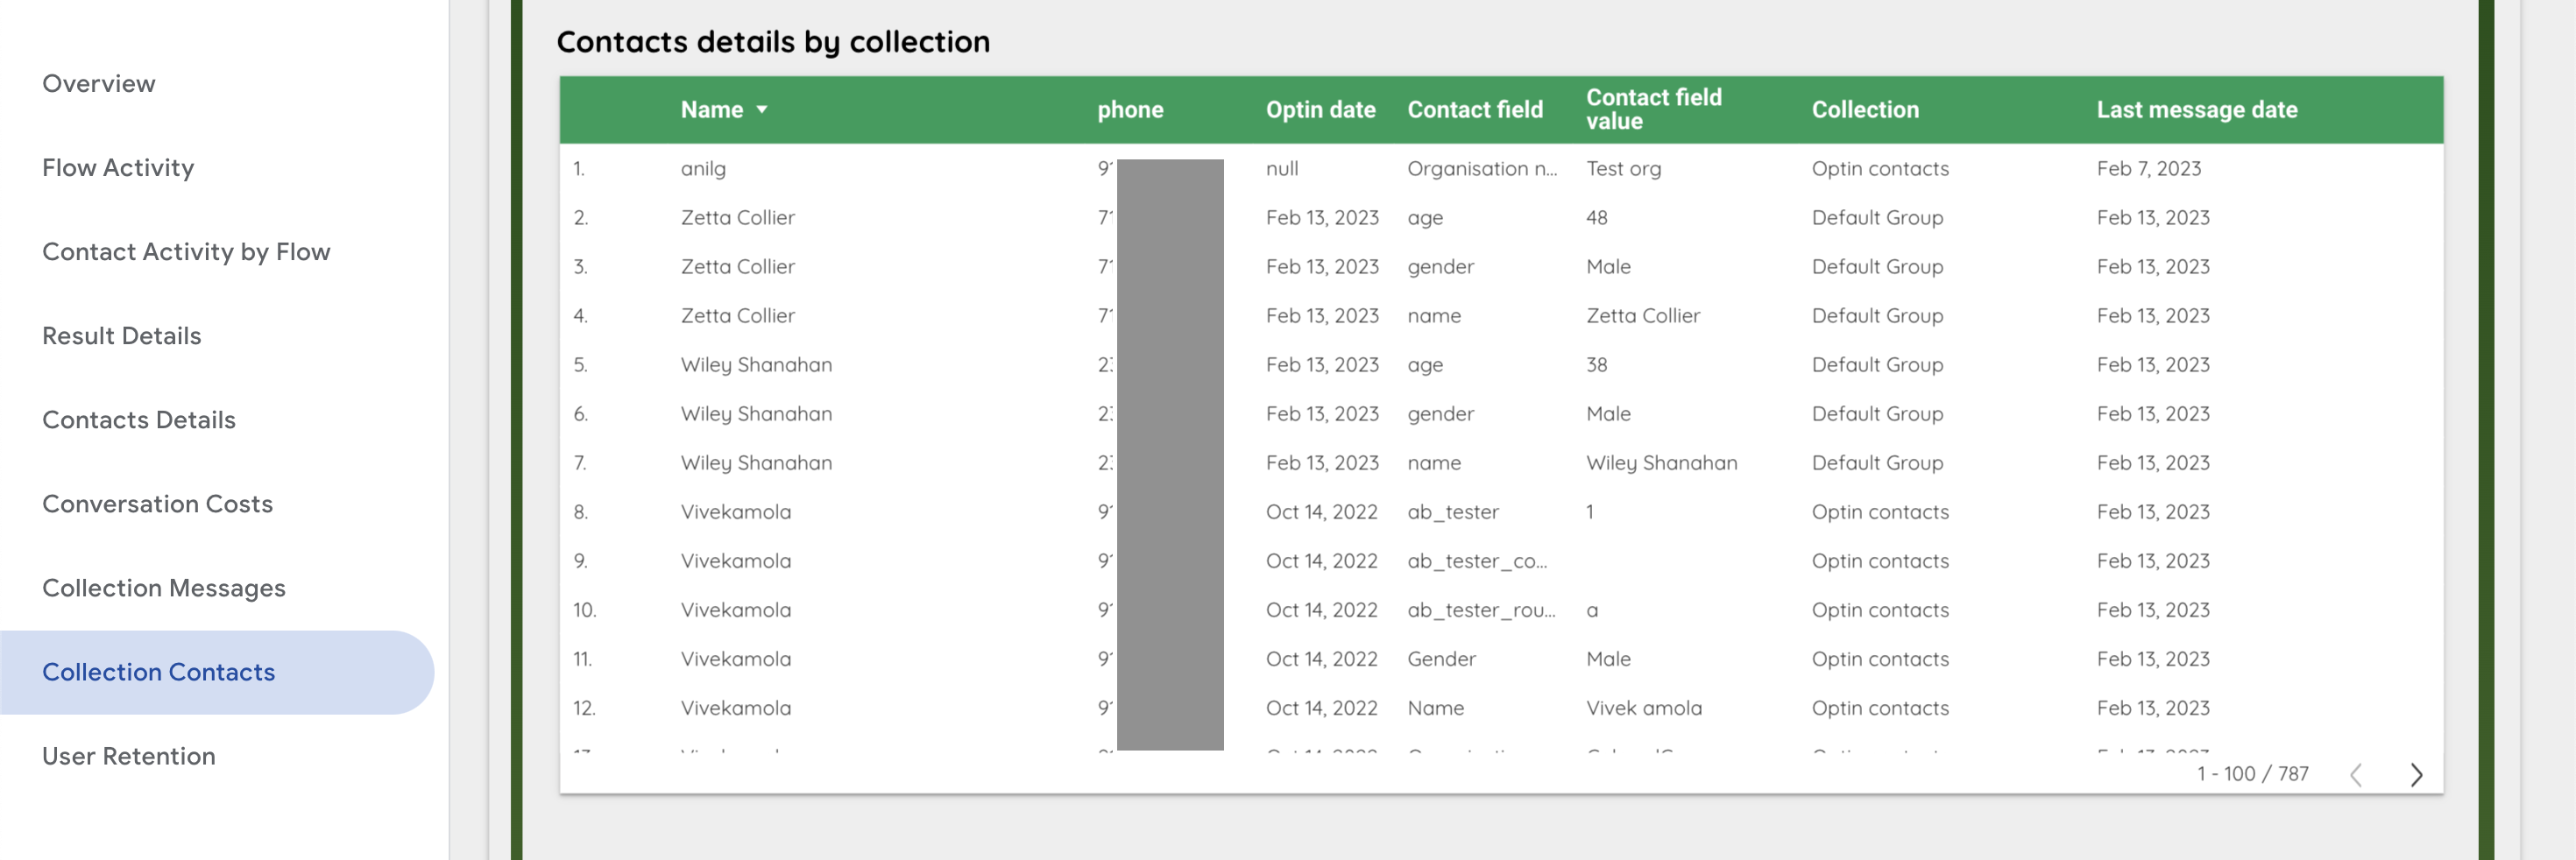
8. Collection Contacts
This page allows you to search for your contacts by the collections that they are part of, check how many there are and extract their details. You can filter this page by date, phone number, and collection name. This page has 3 visuals, described below.
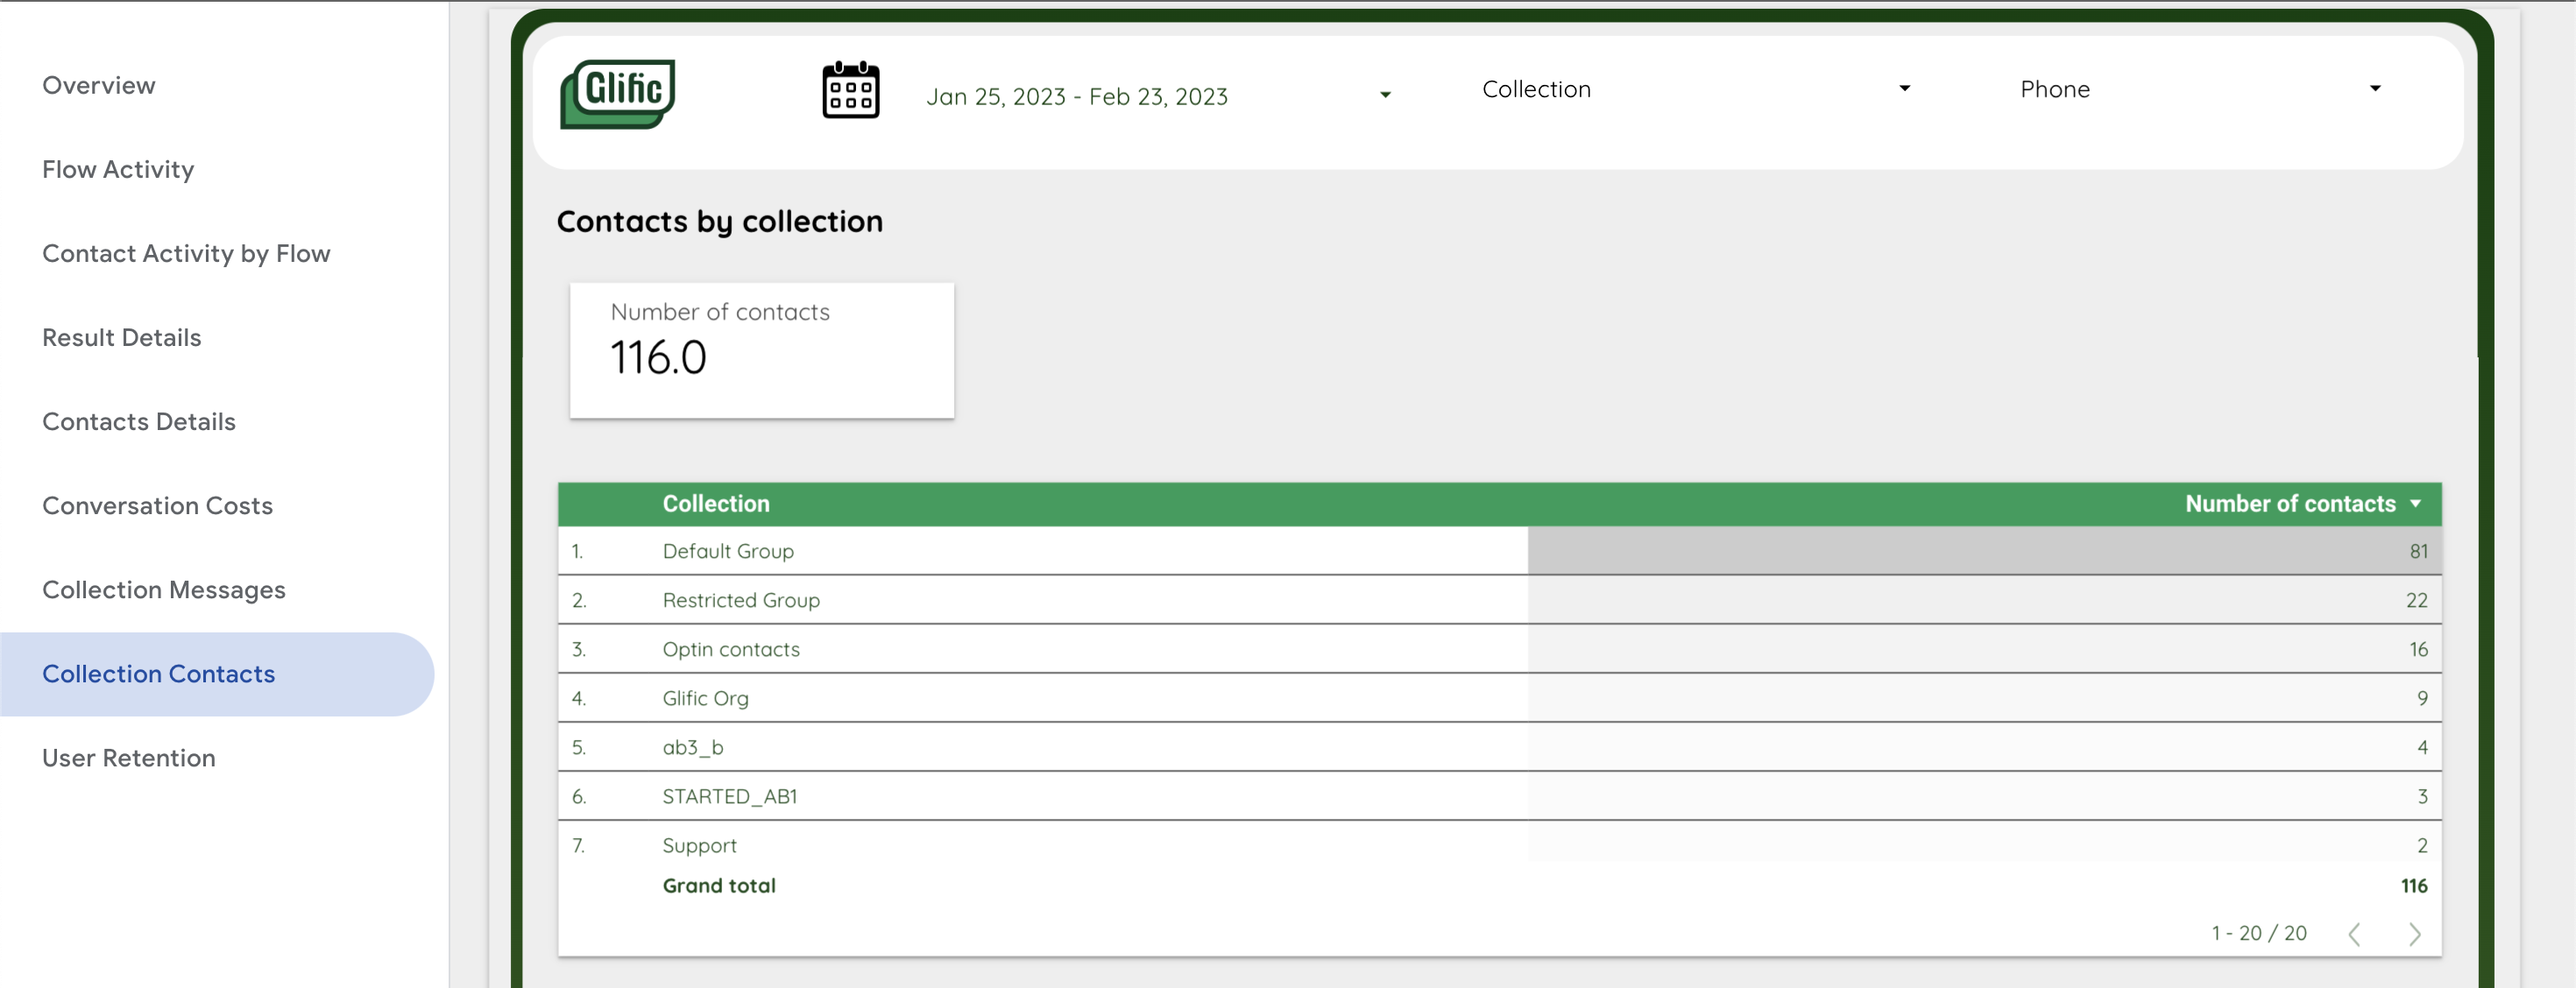
- Number of contacts: The total number of active contacts for the selected time period in your selected collections.
- Contacts by collection table: This table gives you a count of the active contacts for the given time period, per collection selected.
- Contacts details by collection: This table will give you all the contact details by contact field as per the selected filters.
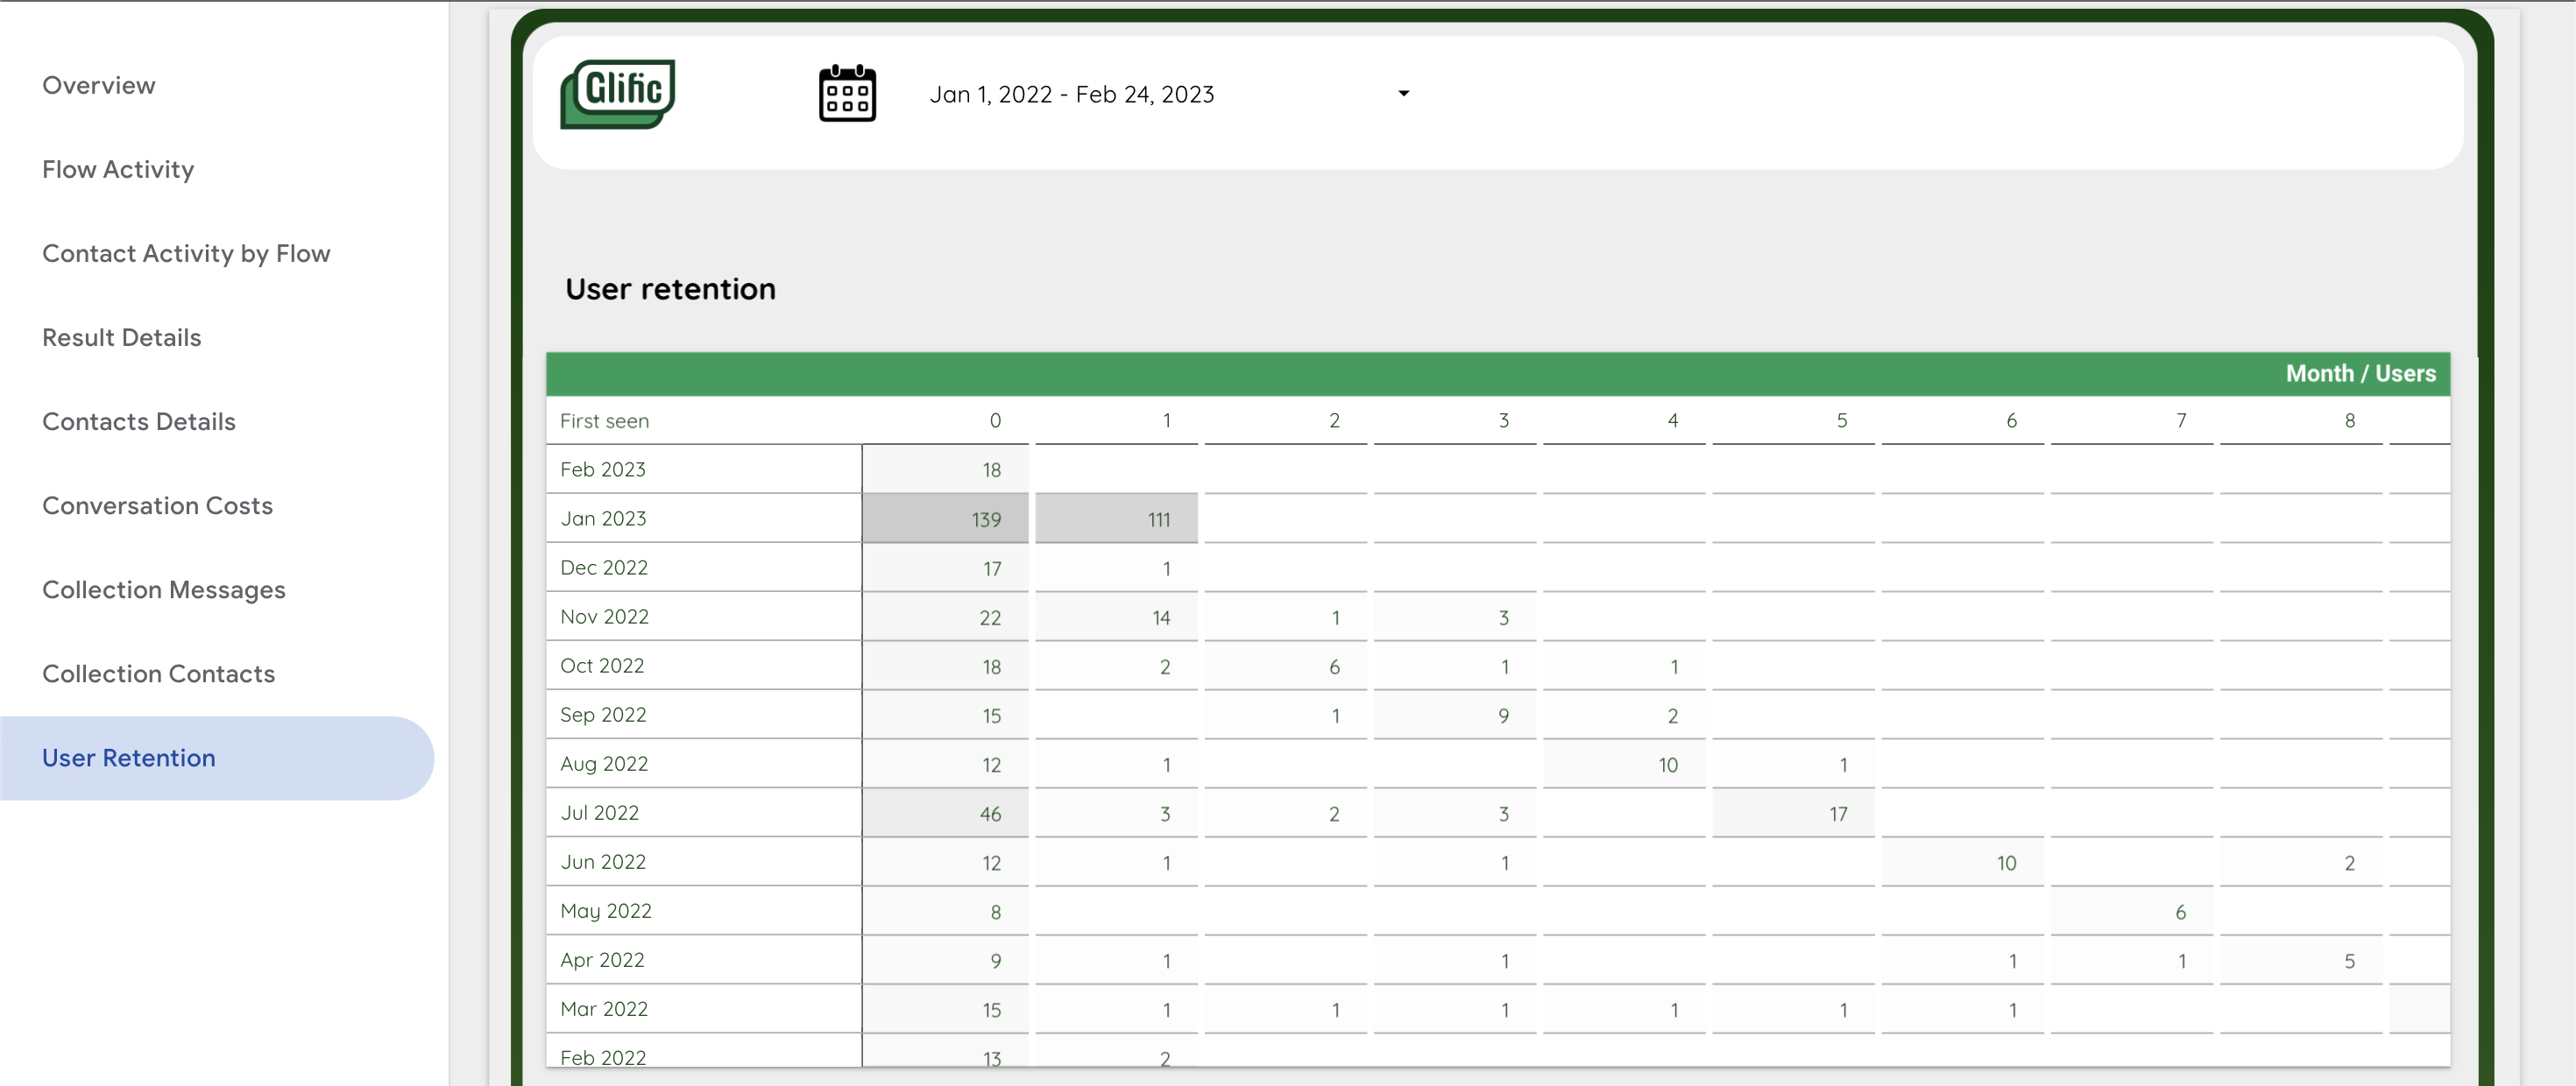
9. User Retention
This page provides you with a view of monthly user retention. it has a date filter set to always show you the past one years data. It contains a single visual which can be understood as follows:
Refer to the row for Nov 2022. In this month, 22 contacts engaged with our bot for the first time (the column labelled '0'). In the following month, 14 of these contacts returned to use the bot (column labelled as '1'), in the following month only one of these users returned. And in the month after that, 3 users from the cohort who first engaged with us in Nov 22 had returned to use the bot.
Additional
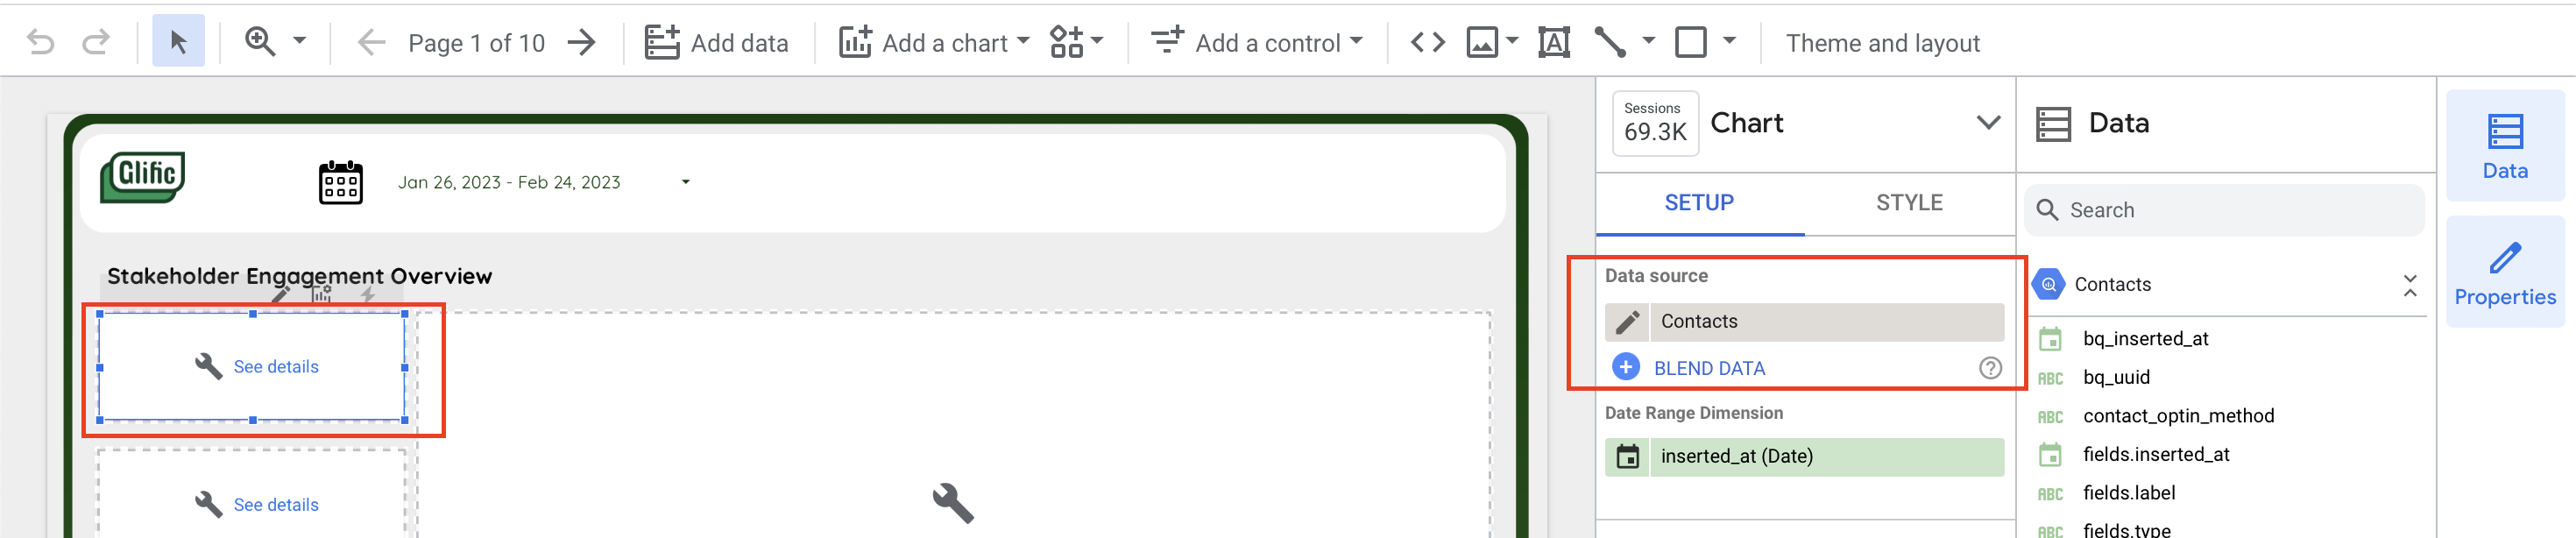
Checking which dataset is being used
Understanding which dataset and fields are being used will help you understand your dashboard better.
- Hover your cursor over the top of the dashboard and click edit at the top right. You will enter the editing mode.
- Click on any visual and refer to the first column on your right. You can see which data source is being used under the heading 'data source'.
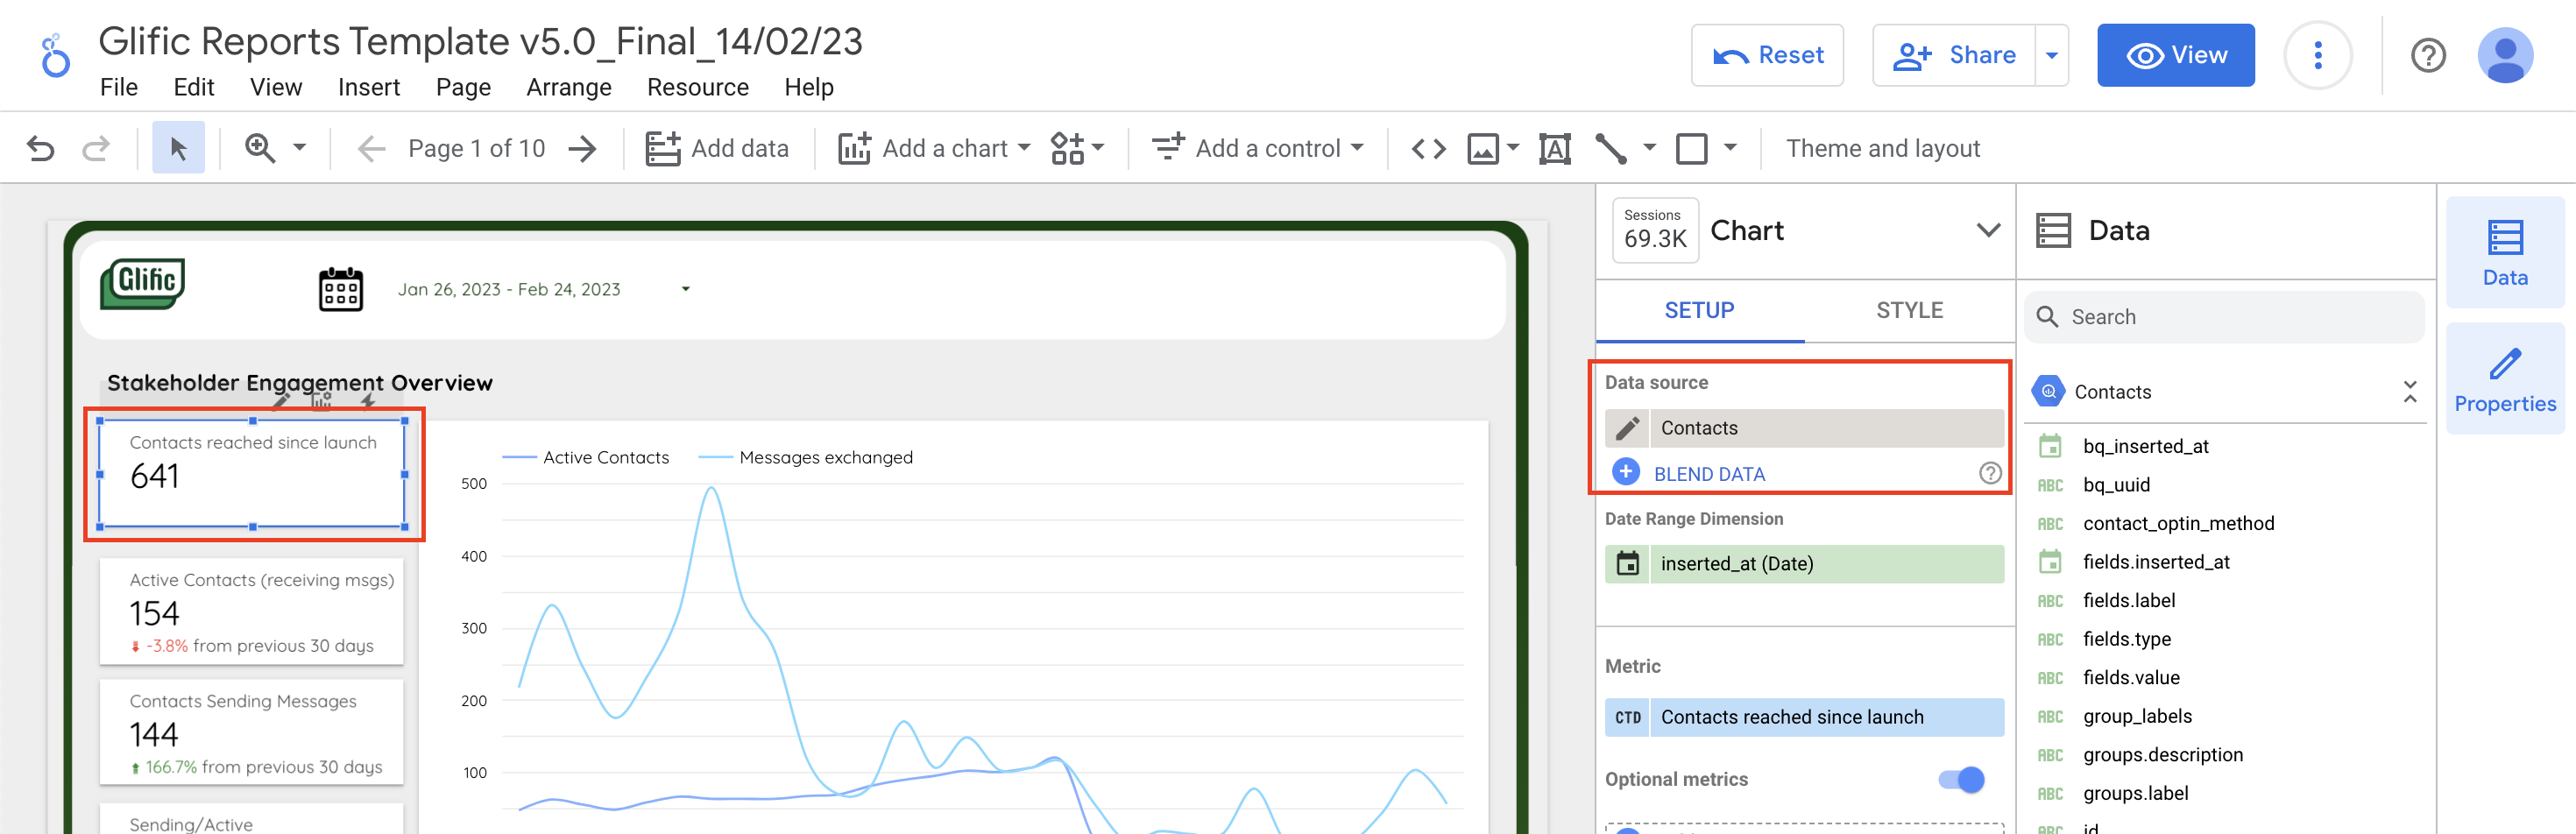
Note: If you have not connected to our V5 template dashbord then first make a copy (option next to edit) and then follow the above steps.
The visuals will not populate until you connect them to your chatbot data sources, but you should still be able to see which dataset its intended to pick up from.
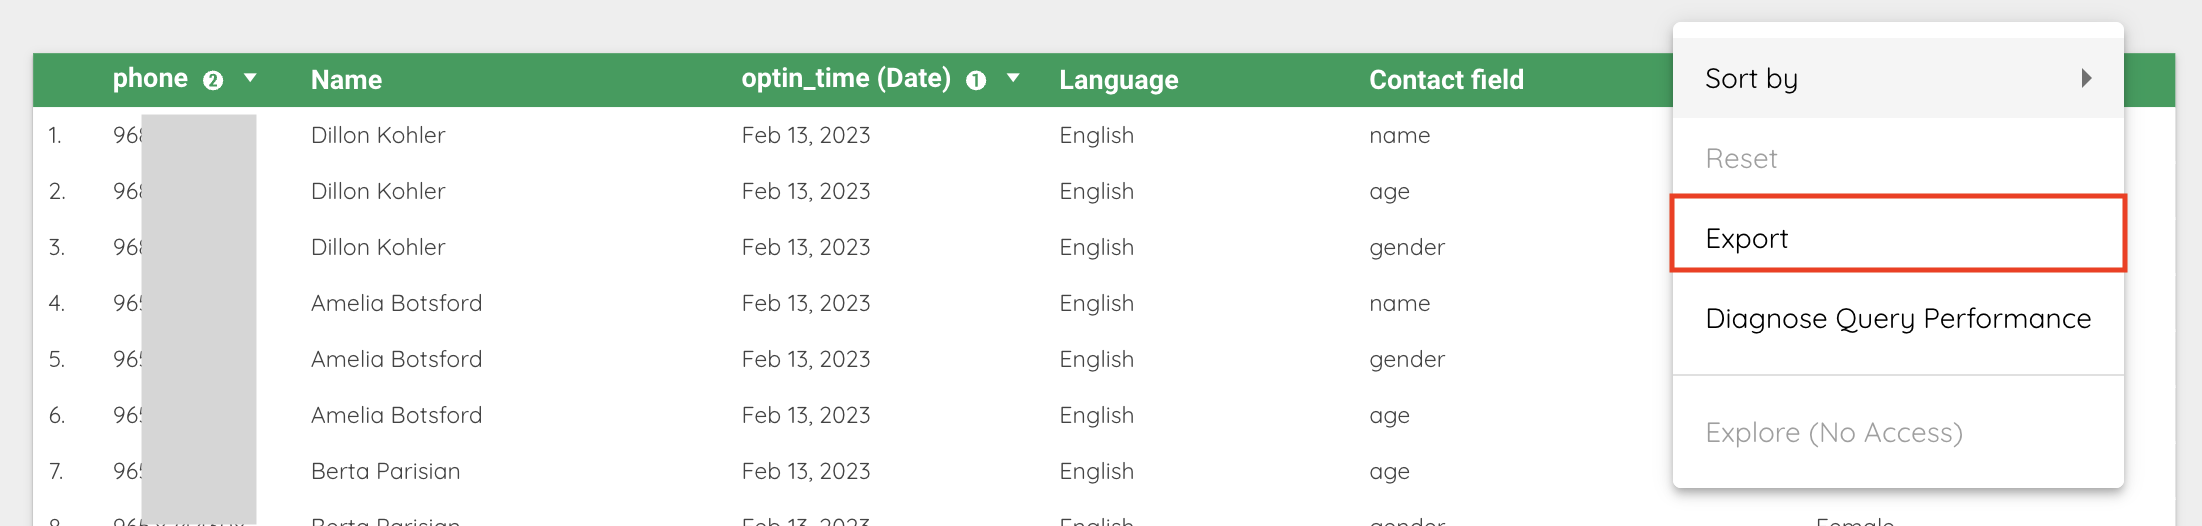
Downloading data
- In view mode, hover your cursor over any visual and click the 3 dots at the top right of the vidual.
- Select export and then pick whichever format you want the data in.